 3
3peptides
spectra
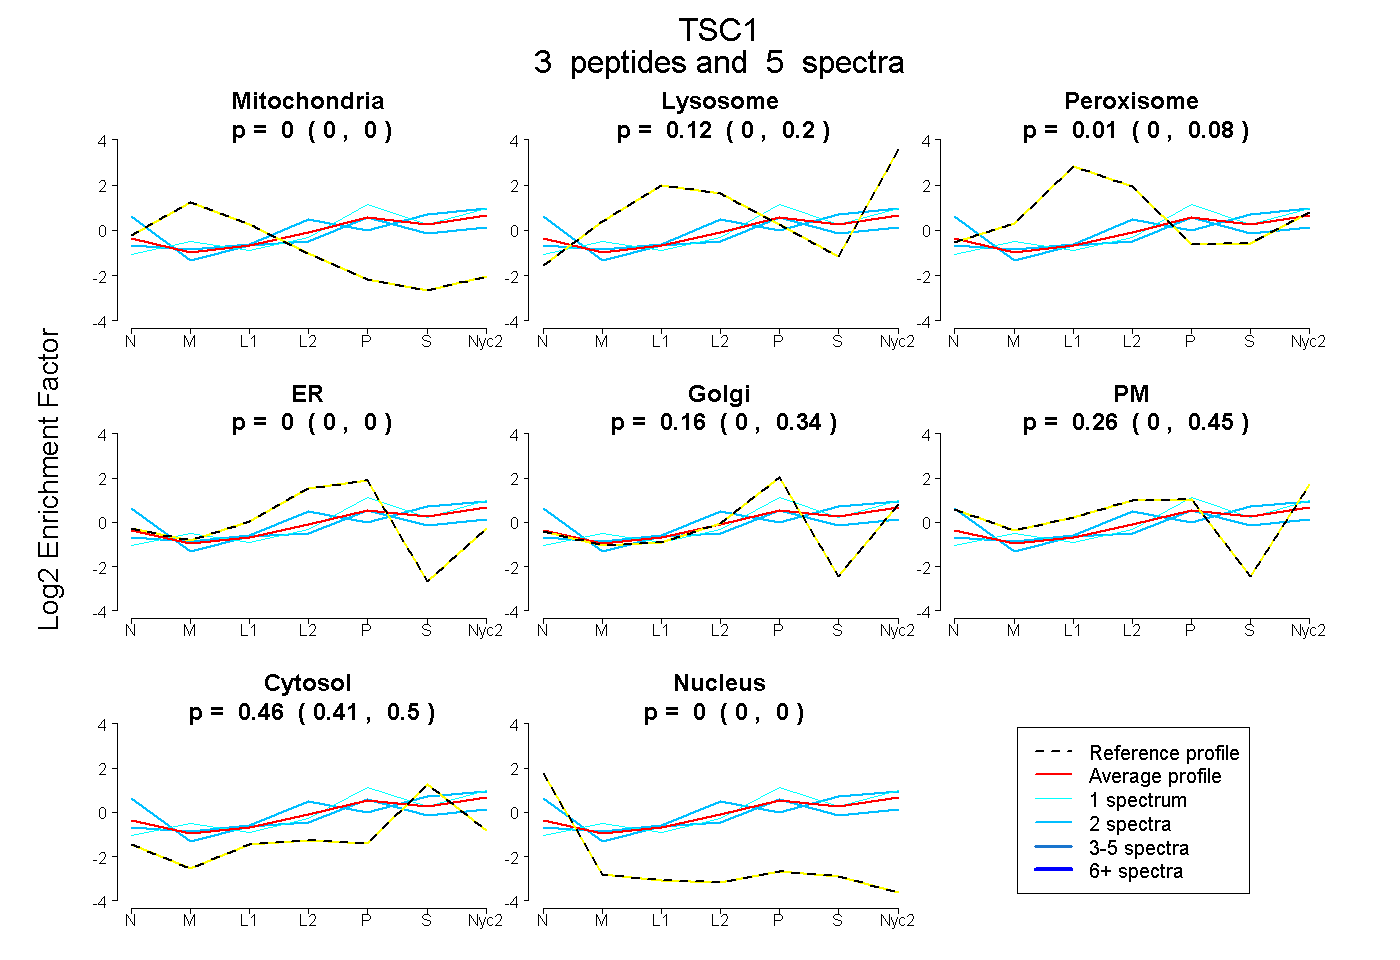
0.000 | 0.000
0.002 | 0.203
0.000 | 0.077
0.000 | 0.000
0.000 | 0.345
0.000 | 0.453
0.407 | 0.500
0.000 | 0.000
1peptide
spectrum
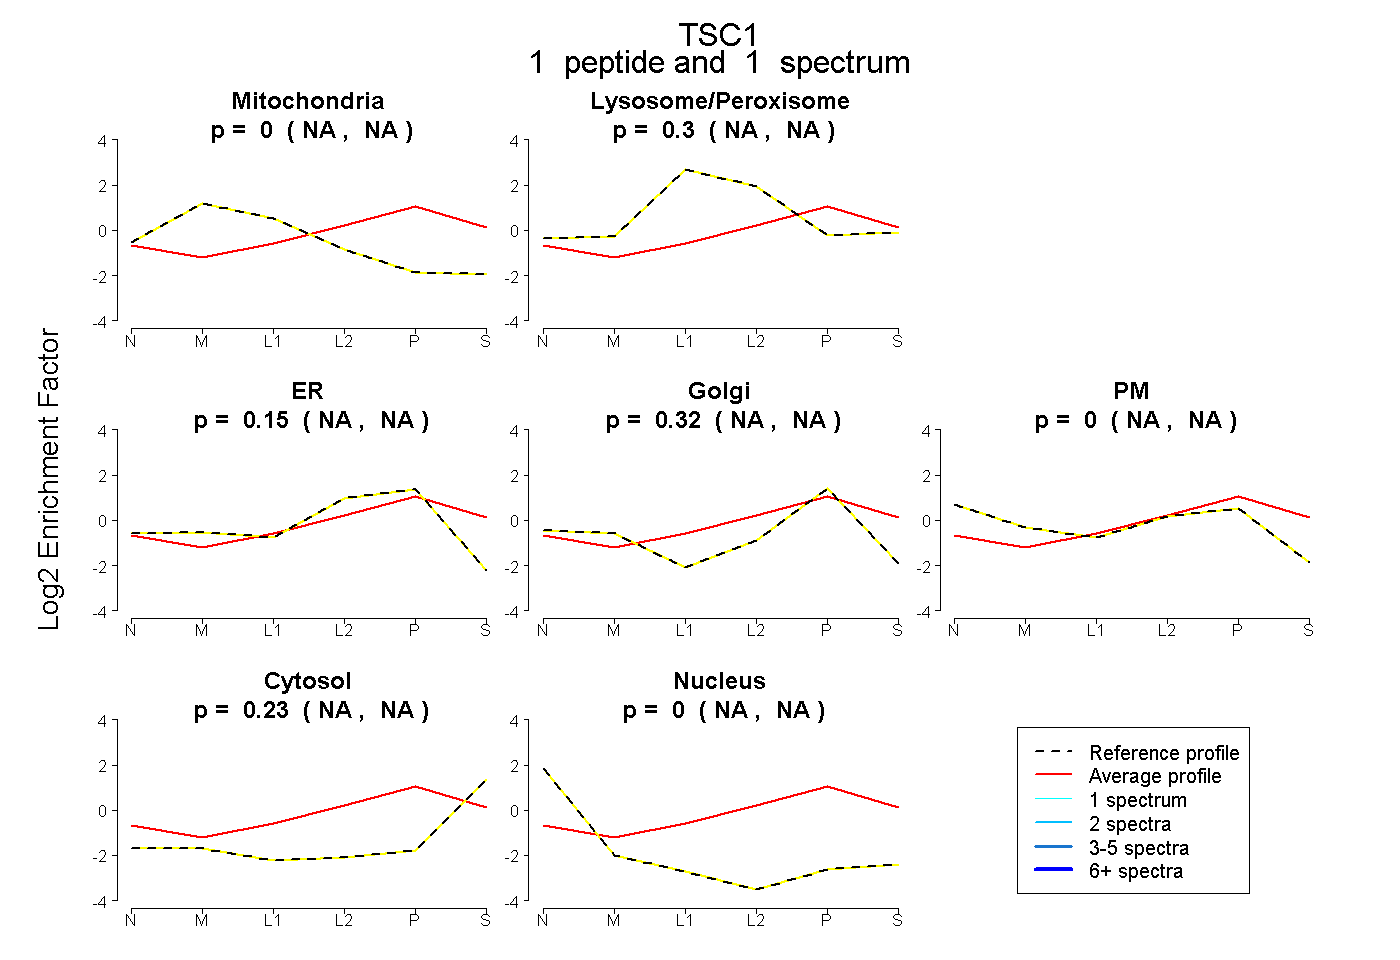
NA | NA
NA | NA
NA | NA
NA | NA
NA | NA
NA | NA
NA | NA
1peptide
spectrum
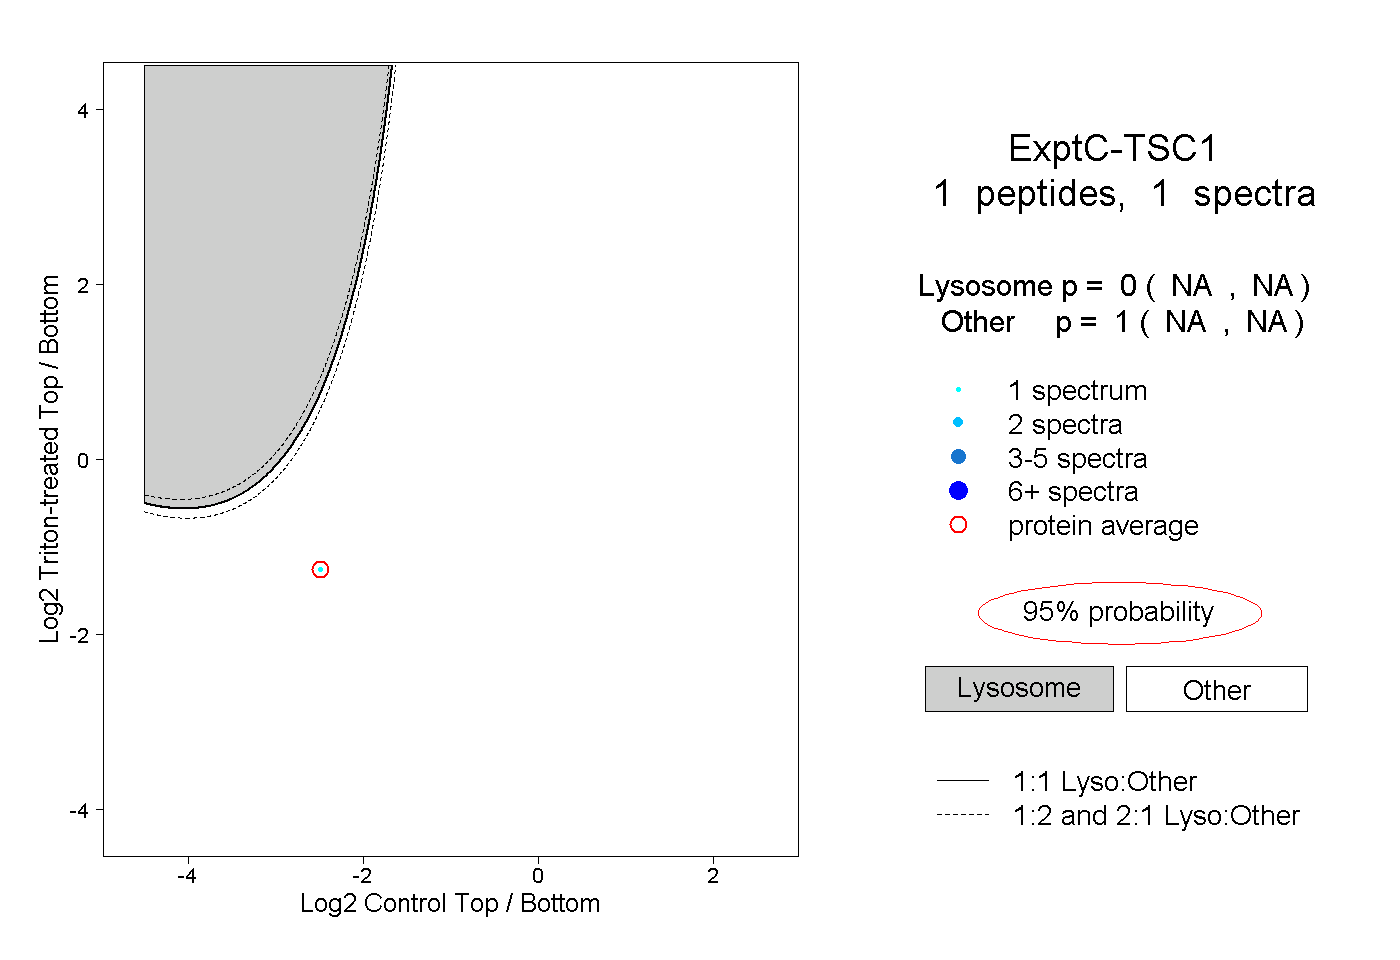
NA | NA
NA | NA