 3
3peptides
spectra
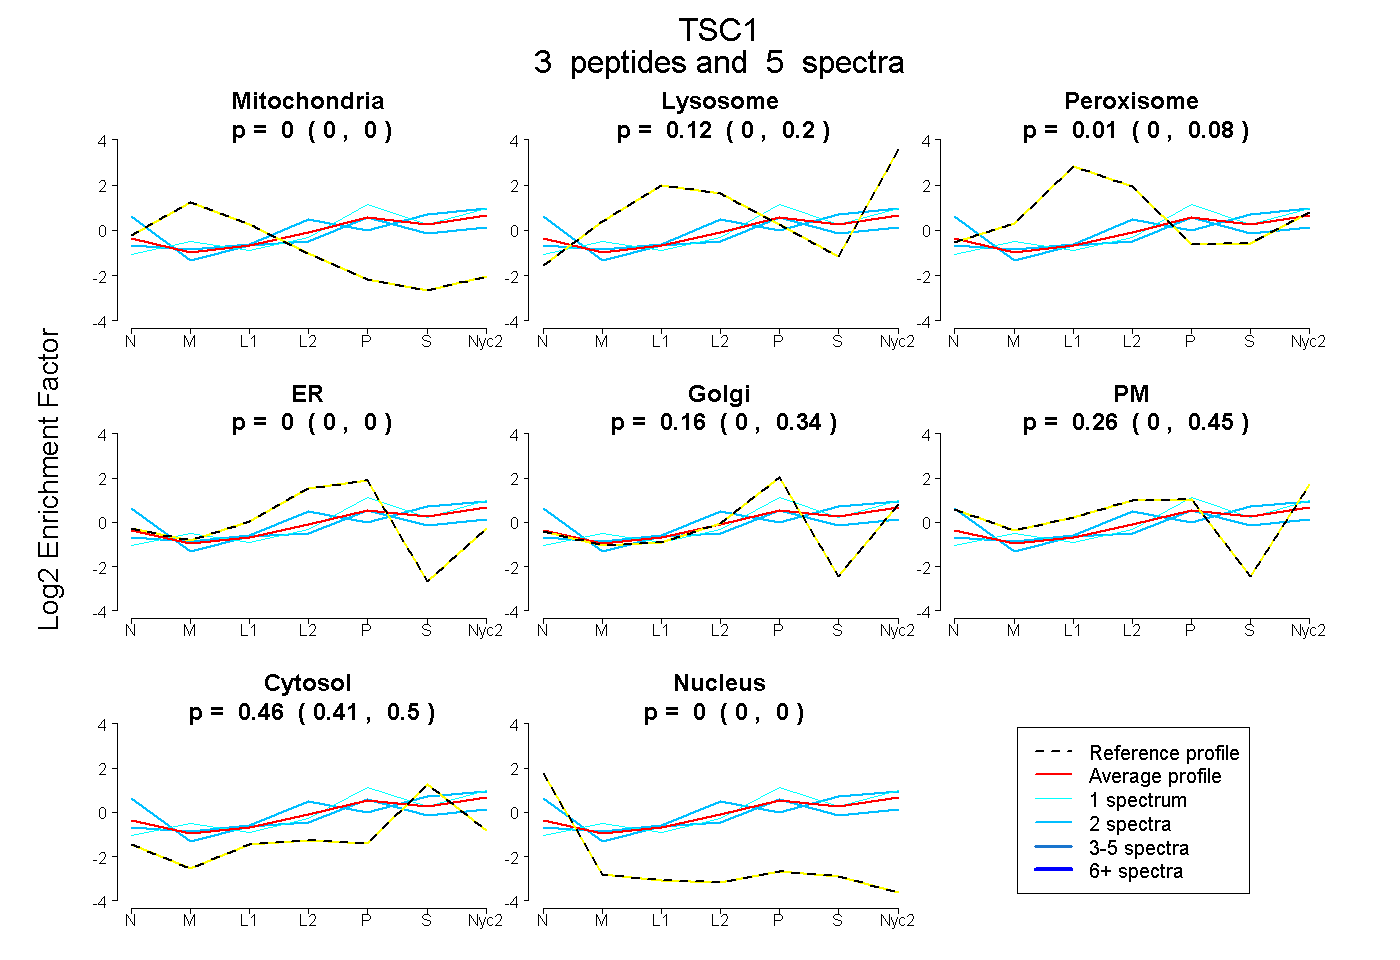
0.000 | 0.000
0.002 | 0.203
0.000 | 0.077
0.000 | 0.000
0.000 | 0.345
0.000 | 0.453
0.407 | 0.500
0.000 | 0.000
| Plot | Mito | Lyso | Perox | ER | Golgi | PM | Cytosol | Nucleus | |||||
| Expt A |
3 peptides |
5 spectra |
|
0.000 0.000 | 0.000 |
0.116 0.002 | 0.203 |
0.006 0.000 | 0.077 |
0.000 0.000 | 0.000 |
0.158 0.000 | 0.345 |
0.256 0.000 | 0.453 |
0.463 0.407 | 0.500 |
0.000 0.000 | 0.000 |
| 2 spectra, DTMVTQLHSQIR | 0.000 | 0.000 | 0.000 | 0.000 | 0.078 | 0.454 | 0.429 | 0.040 | ||
| 2 spectra, DHELDPR | 0.000 | 0.276 | 0.005 | 0.000 | 0.000 | 0.201 | 0.518 | 0.000 | ||
| 1 spectrum, VLELESLLAK | 0.000 | 0.223 | 0.000 | 0.000 | 0.400 | 0.000 | 0.377 | 0.000 |
| Plot | Mito | Lyso or Perox | ER | Golgi | PM | Cytosol | Nucleus | ||||||
| Expt B |
1 peptide |
1 spectrum |
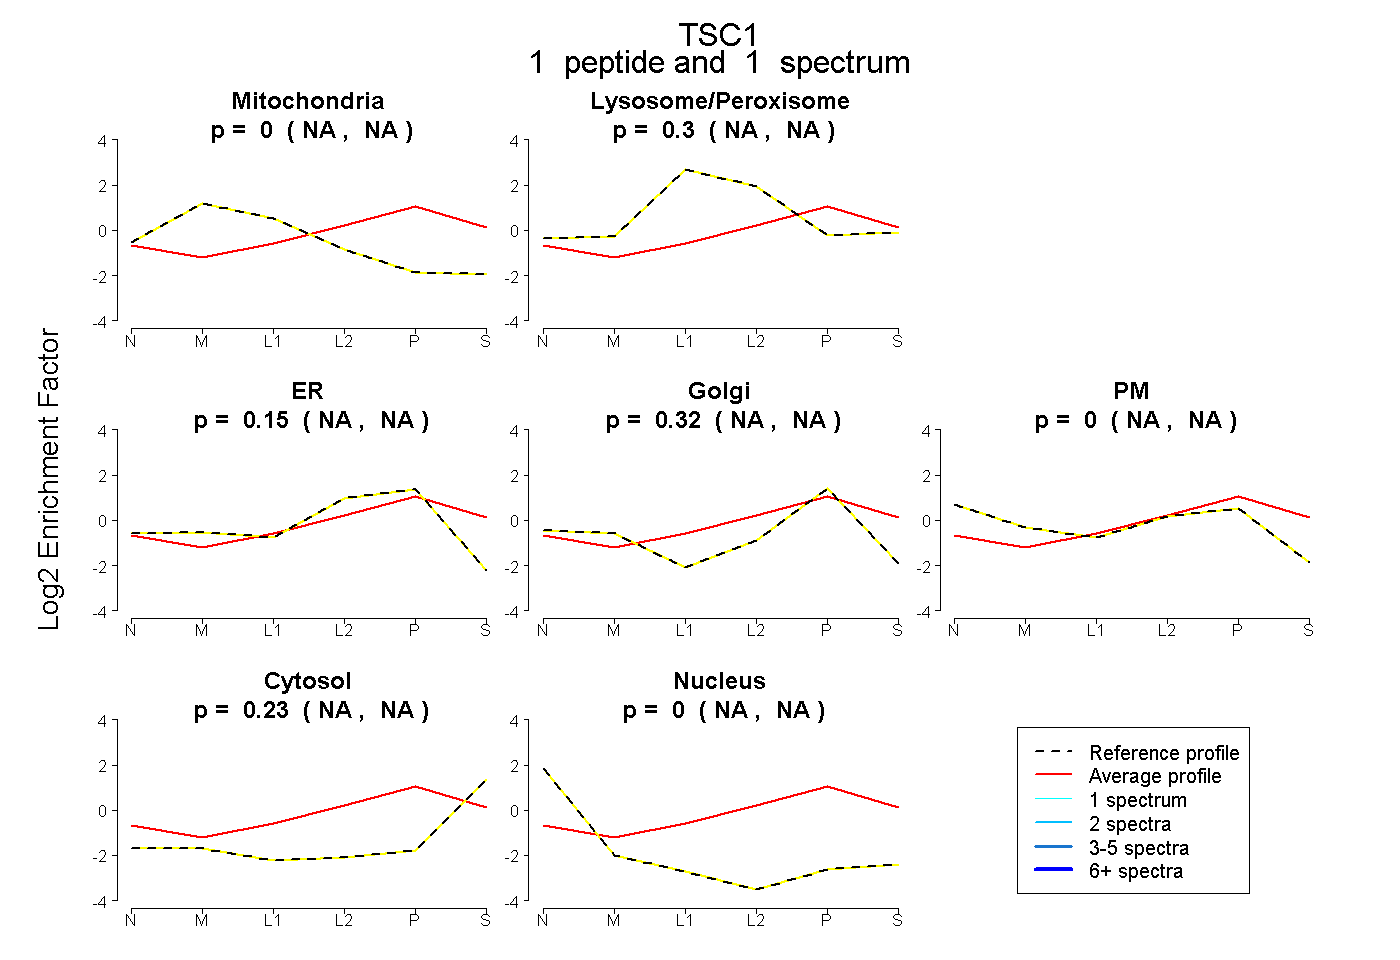 |
0.000 NA | NA |
0.301 NA | NA |
0.151 NA | NA |
0.316 NA | NA |
0.000 NA | NA |
0.232 NA | NA |
0.000 NA | NA |
|||
| Plot | Lyso | Other | |||||||||||
| Expt C |
1 peptide |
1 spectrum |
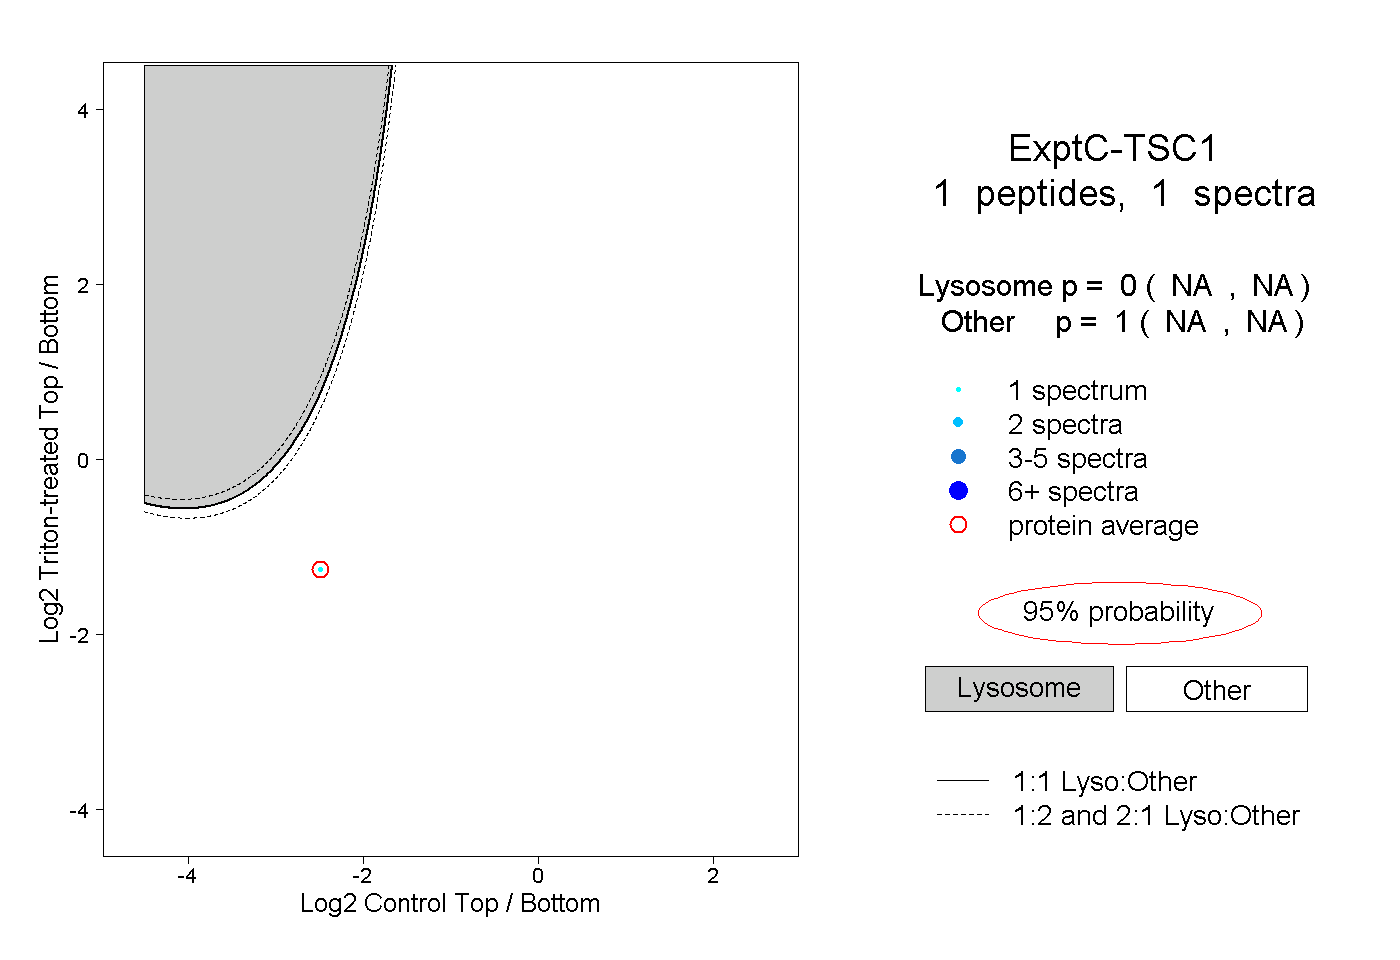 |
0.000 NA | NA |
1.000 NA | NA |