 6
6peptides
spectra
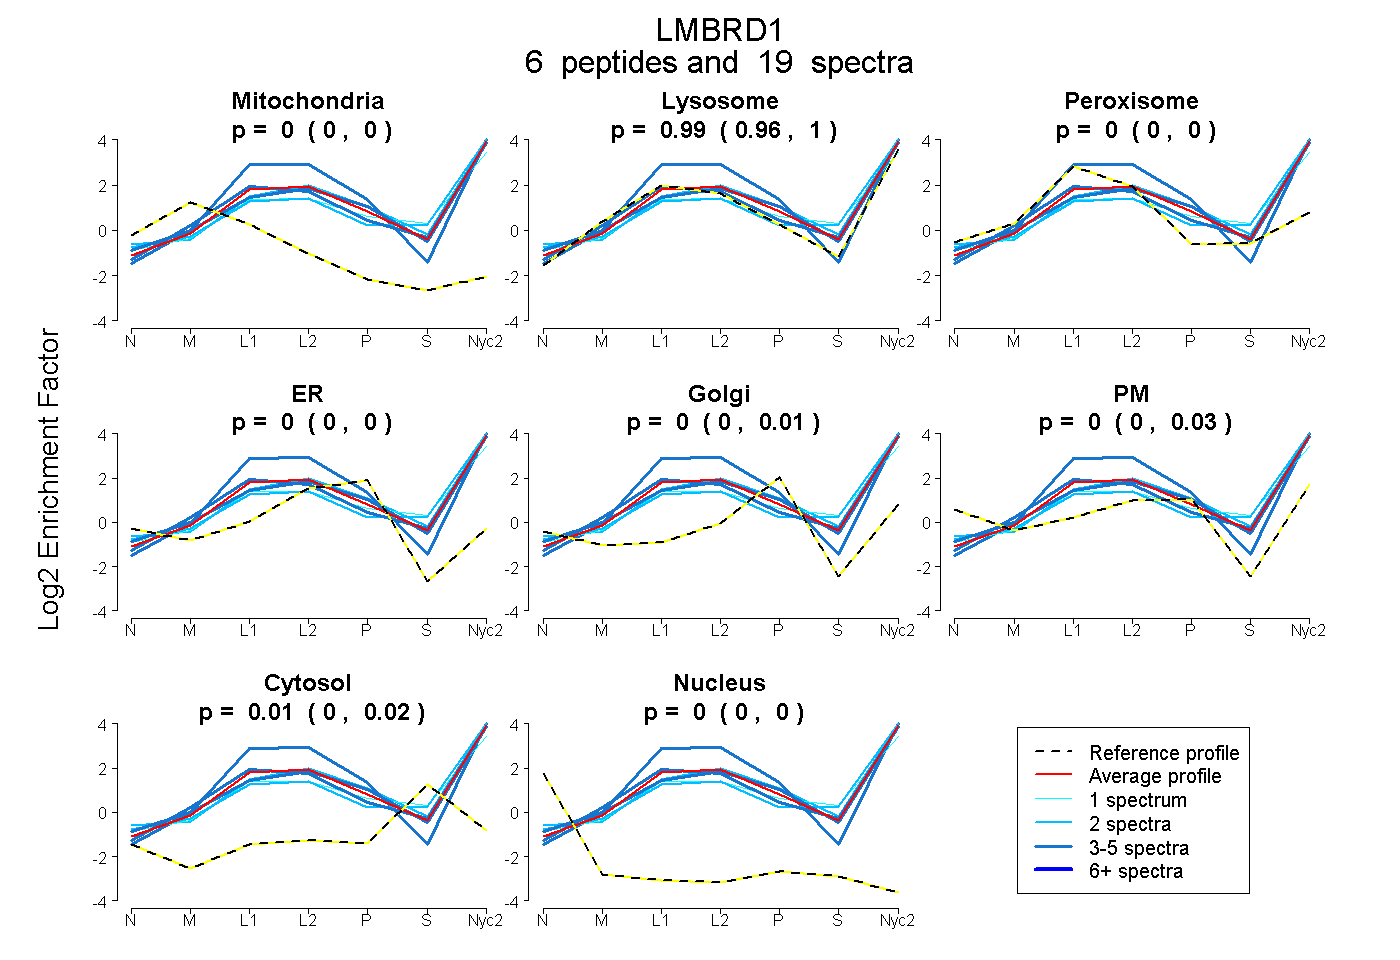
0.000 | 0.000
0.959 | 0.995
0.000 | 0.000
0.000 | 0.000
0.000 | 0.006
0.000 | 0.030
0.000 | 0.020
0.000 | 0.000
1peptide
spectra
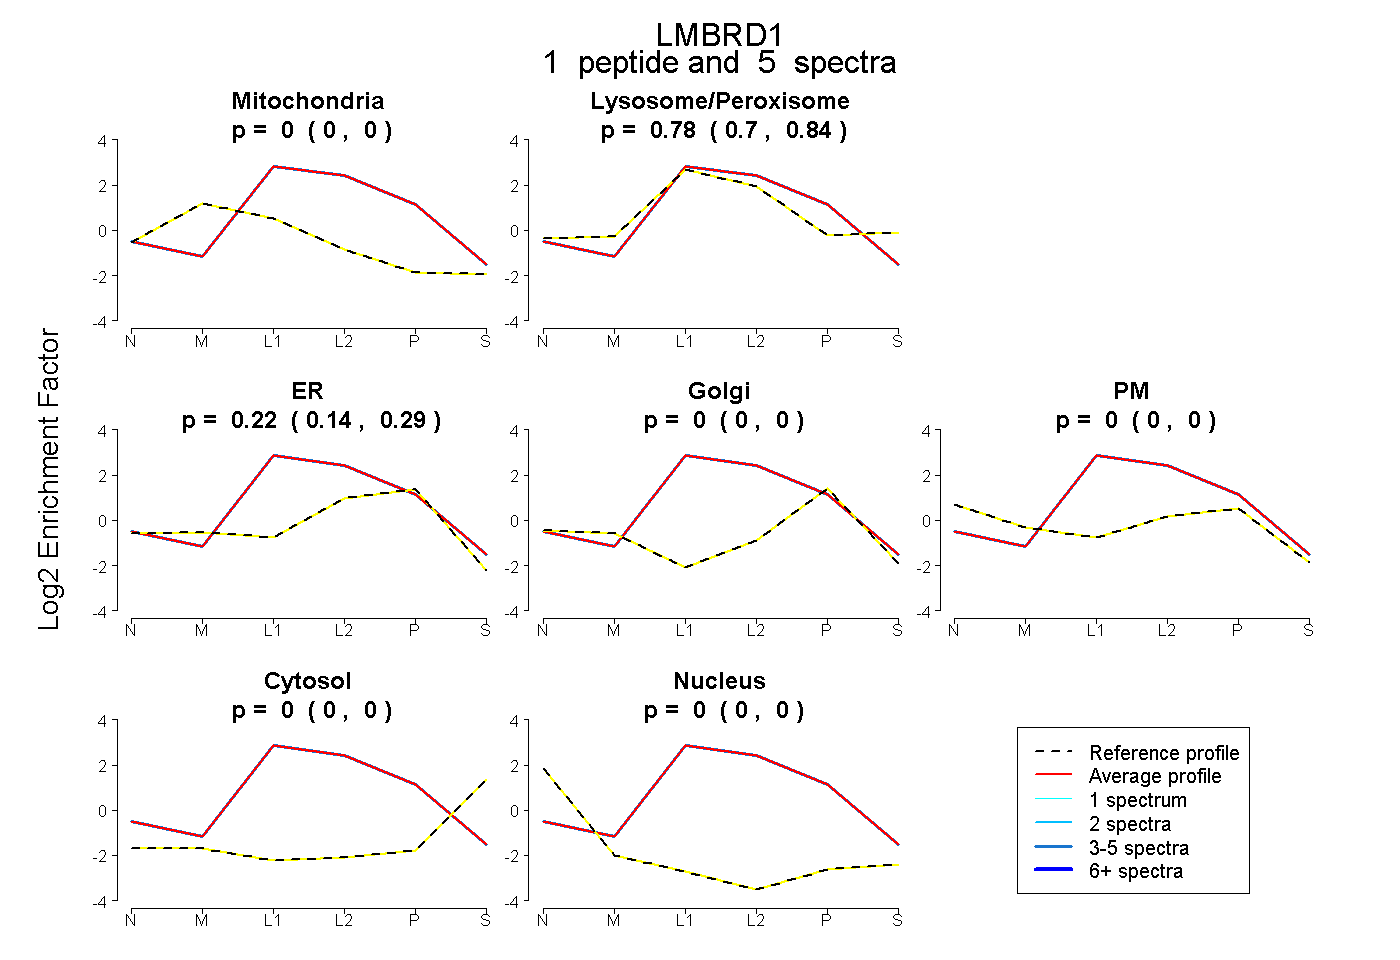
0.000 | 0.000
0.698 | 0.843
0.139 | 0.287
0.000 | 0.000
0.000 | 0.000
0.000 | 0.000
0.000 | 0.000
5peptides
spectra
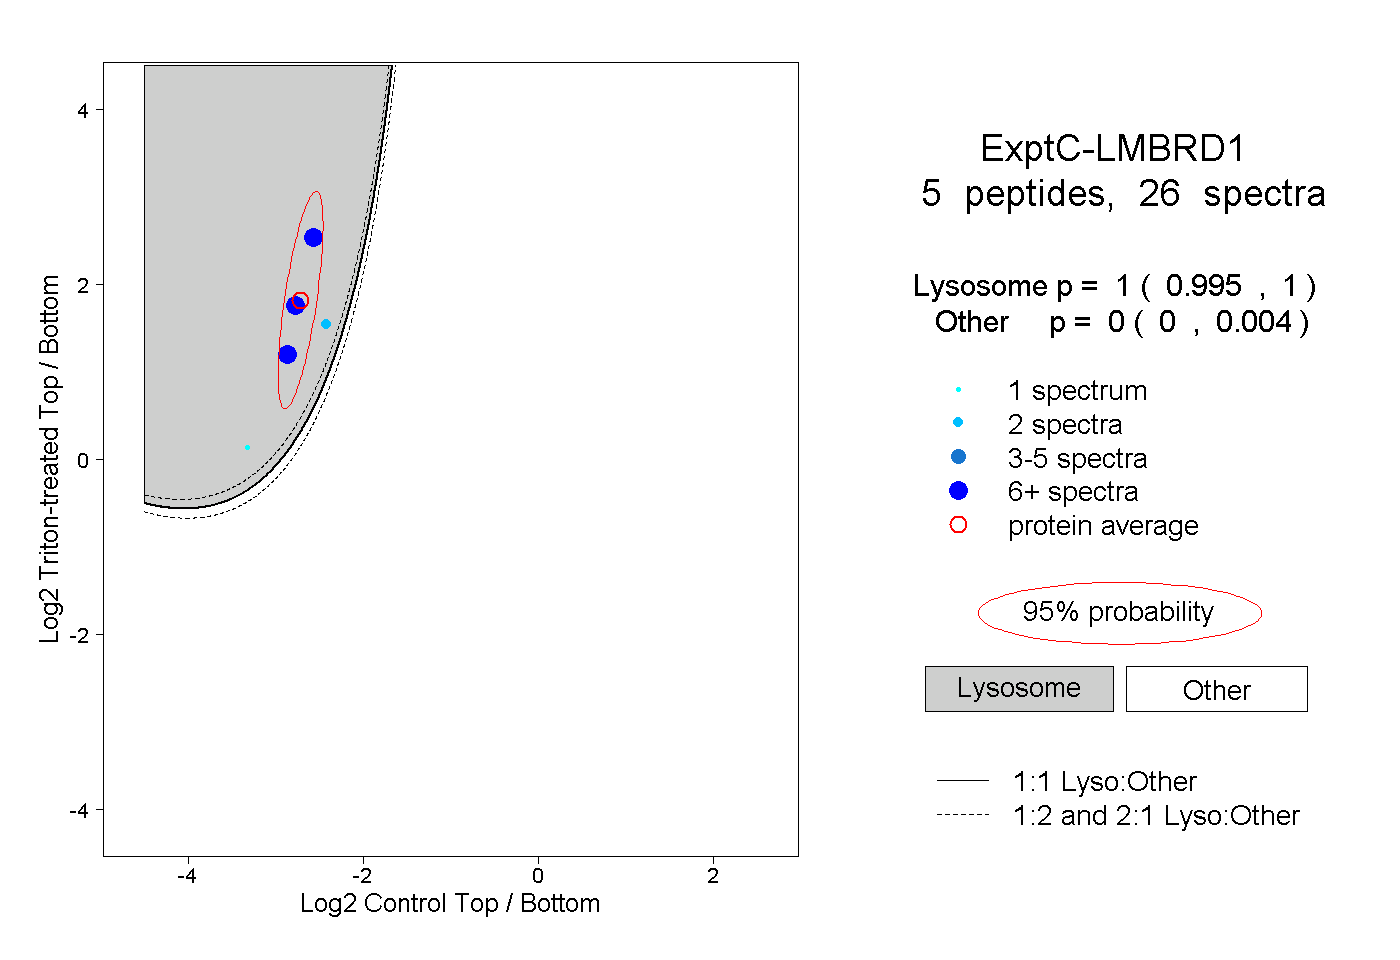
0.995 | 1.000
0.000 | 0.004
2peptides
spectra
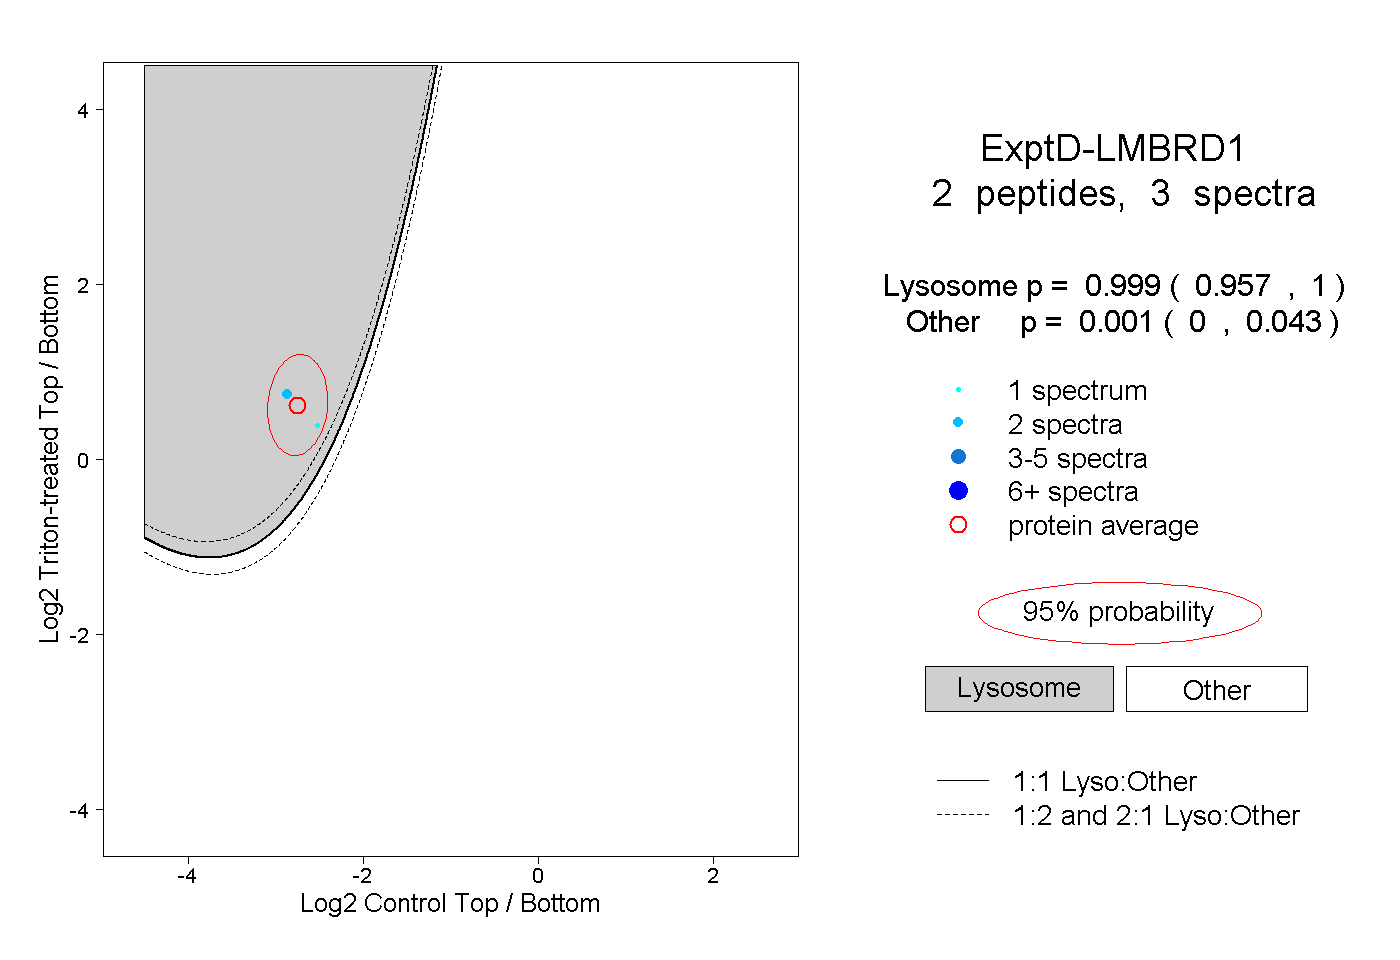
0.957 | 1.000
0.000 | 0.043