 6
6peptides
spectra
0.000 | 0.000
0.959 | 0.995
0.000 | 0.000
0.000 | 0.000
0.000 | 0.006
0.000 | 0.030
0.000 | 0.020
0.000 | 0.000
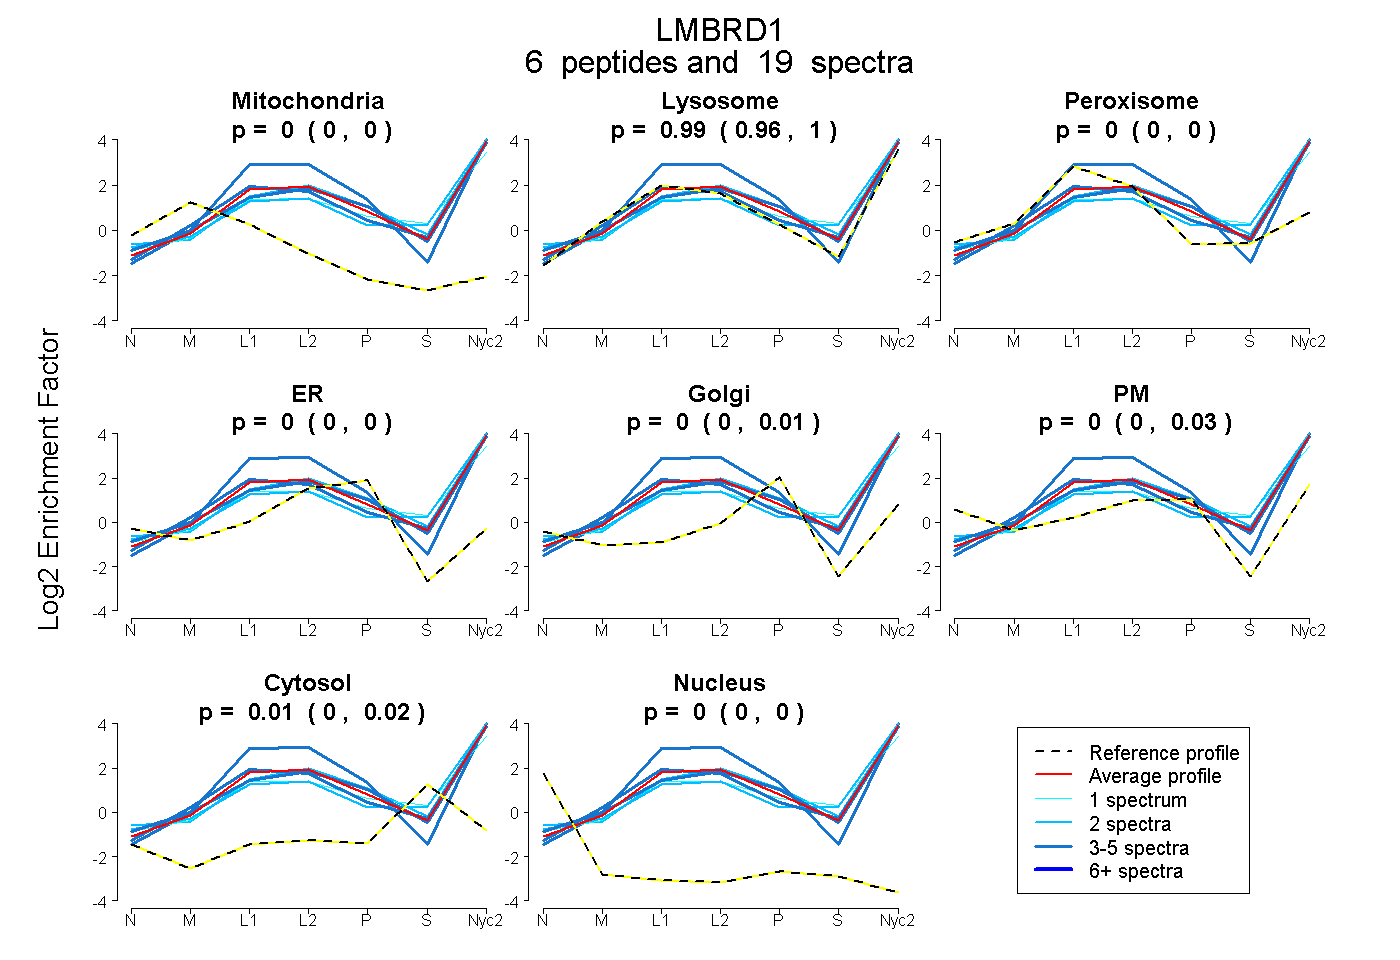
| Plot | Mito | Lyso | Perox | ER | Golgi | PM | Cytosol | Nucleus | |||||
| Expt A |
6 peptides |
19 spectra |
|
0.000 0.000 | 0.000 |
0.985 0.959 | 0.995 |
0.000 0.000 | 0.000 |
0.000 0.000 | 0.000 |
0.000 0.000 | 0.006 |
0.004 0.000 | 0.030 |
0.011 0.000 | 0.020 |
0.000 0.000 | 0.000 |
| 5 spectra, STAYER | 0.000 | 0.988 | 0.000 | 0.000 | 0.000 | 0.000 | 0.012 | 0.000 | ||
| 2 spectra, LENTEDIEEVEQHIQTIR | 0.000 | 0.880 | 0.000 | 0.000 | 0.000 | 0.000 | 0.120 | 0.000 | ||
| 2 spectra, DGRPLSAR | 0.000 | 0.880 | 0.000 | 0.000 | 0.000 | 0.108 | 0.011 | 0.000 | ||
| 5 spectra, DQCTVTR | 0.000 | 1.000 | 0.000 | 0.000 | 0.000 | 0.000 | 0.000 | 0.000 | ||
| 1 spectrum, HLEFIENSWWTK | 0.000 | 0.851 | 0.000 | 0.000 | 0.000 | 0.000 | 0.149 | 0.000 | ||
| 4 spectra, TYVFLHK | 0.000 | 0.888 | 0.000 | 0.000 | 0.012 | 0.099 | 0.000 | 0.000 |
| Plot | Mito | Lyso or Perox | ER | Golgi | PM | Cytosol | Nucleus | ||||||
| Expt B |
1 peptide |
5 spectra |
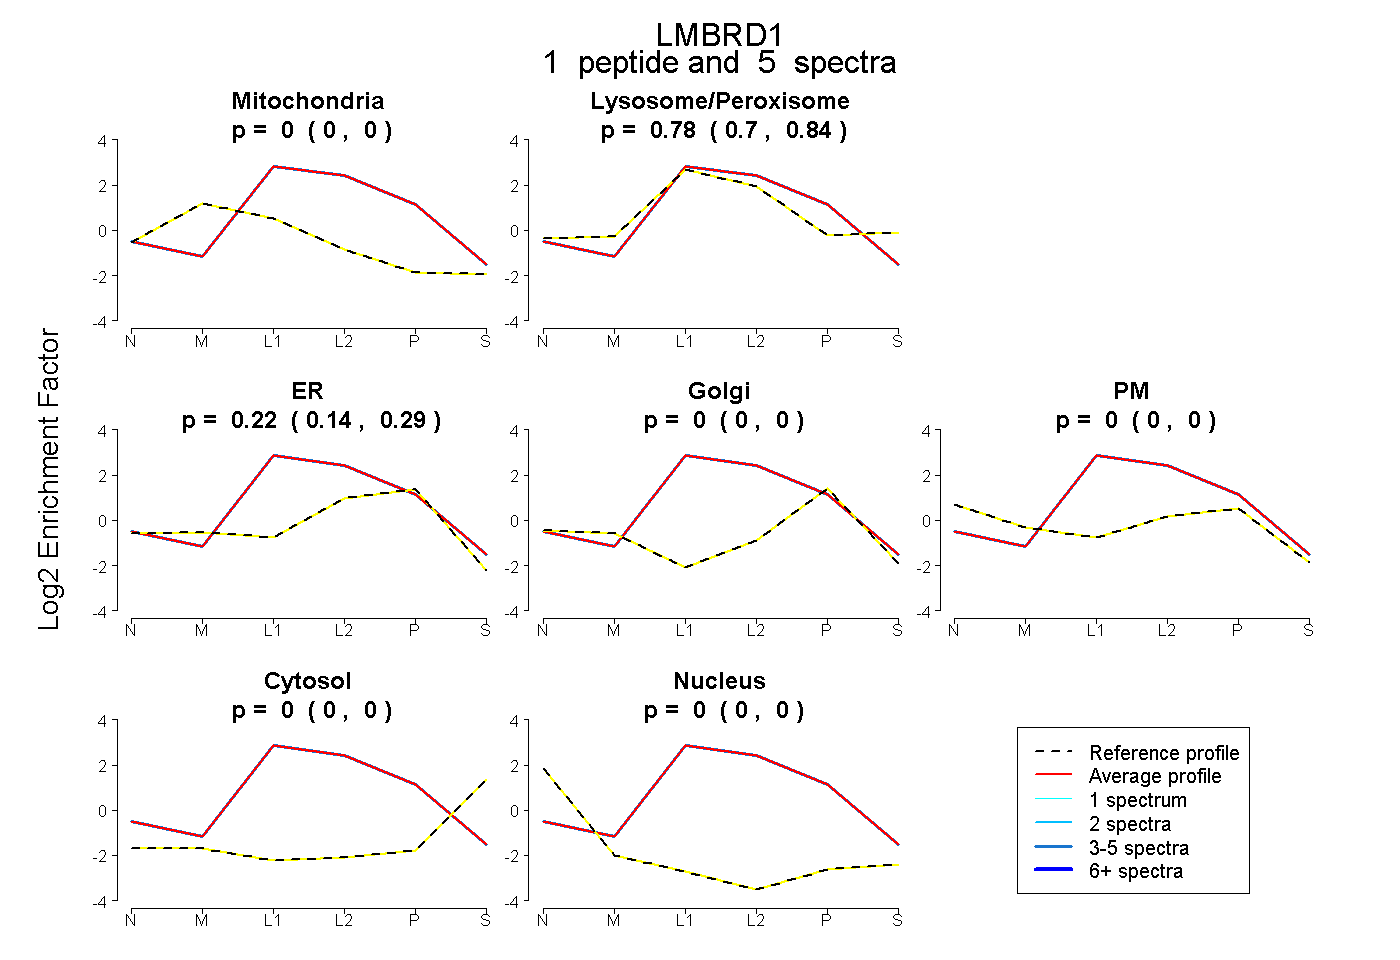 |
0.000 0.000 | 0.000 |
0.781 0.698 | 0.843 |
0.219 0.139 | 0.287 |
0.000 0.000 | 0.000 |
0.000 0.000 | 0.000 |
0.000 0.000 | 0.000 |
0.000 0.000 | 0.000 |
|||
| Plot | Lyso | Other | |||||||||||
| Expt C |
5 peptides |
26 spectra |
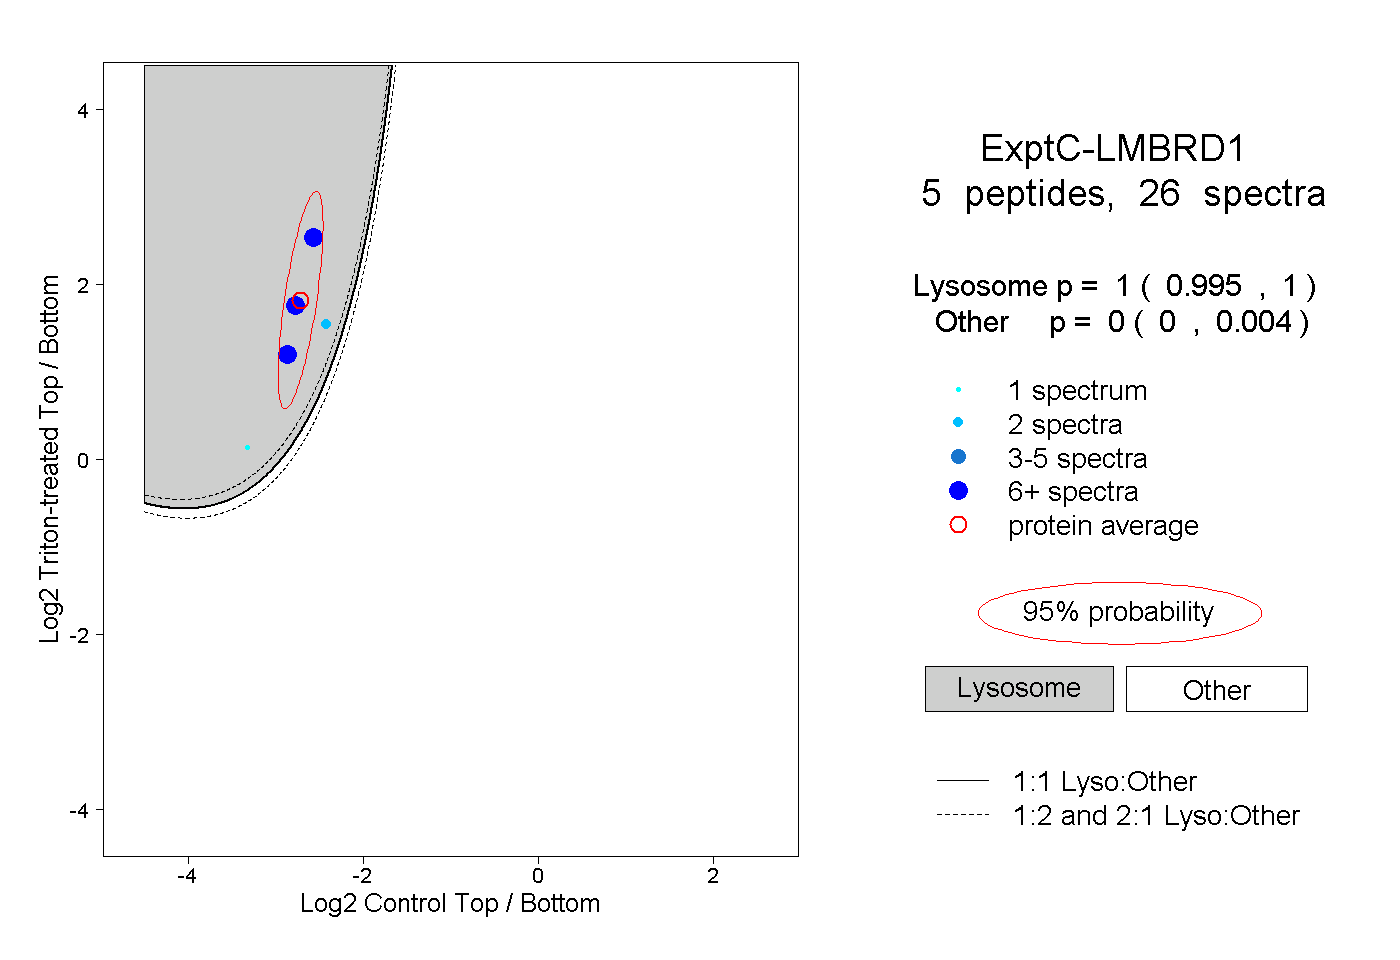 |
1.000 0.995 | 1.000 |
0.000 0.000 | 0.004 |
||||||||
| Plot | Lyso | Other | |||||||||||
| Expt D |
2 peptides |
3 spectra |
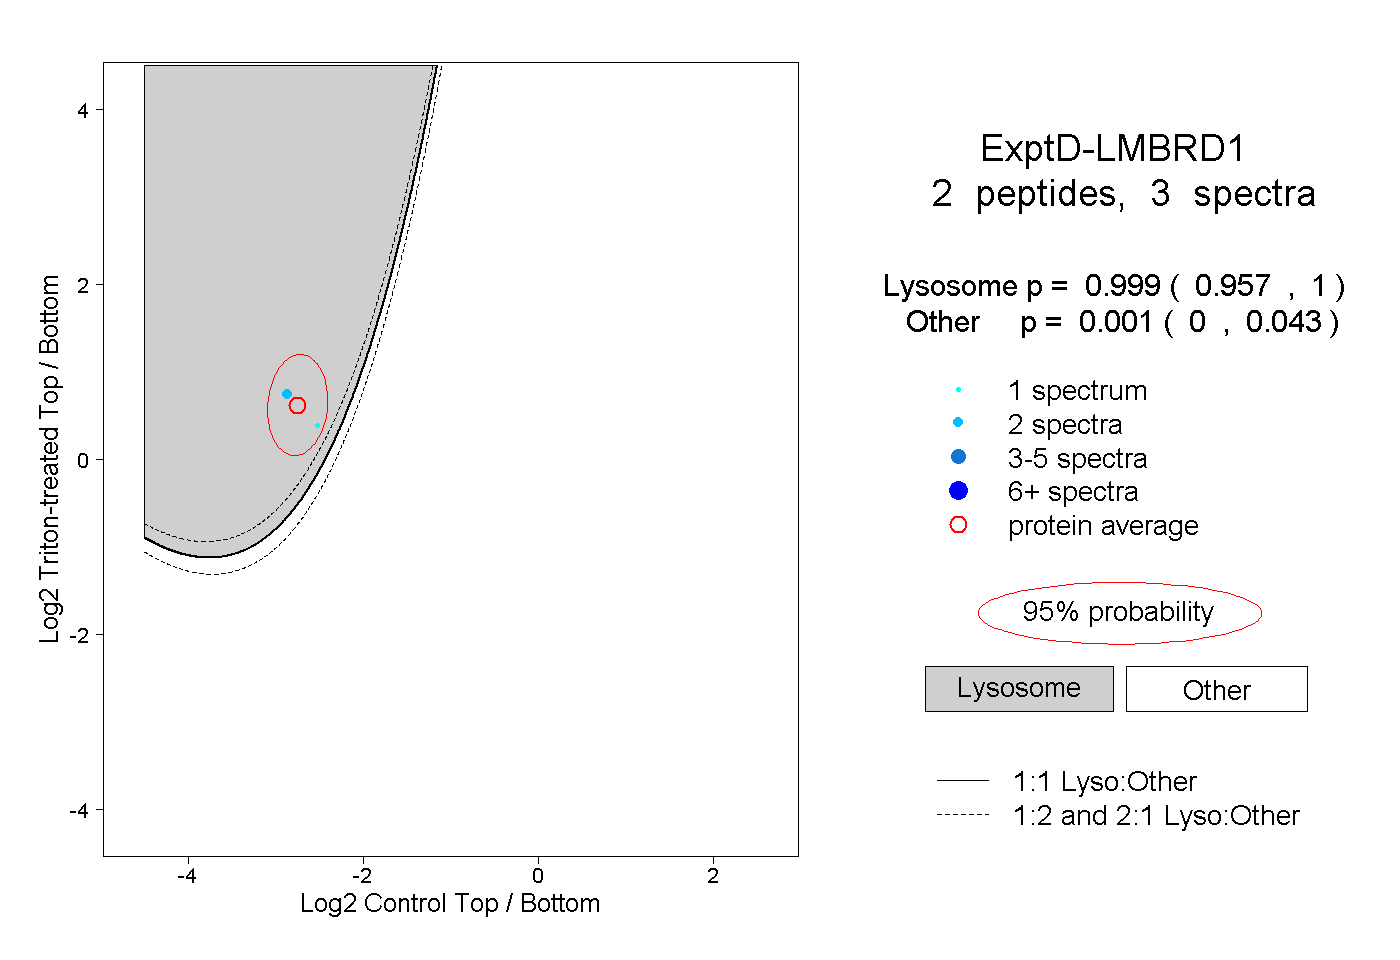 |
0.999 0.957 | 1.000 |
0.001 0.000 | 0.043 |