 4
4peptides
spectra
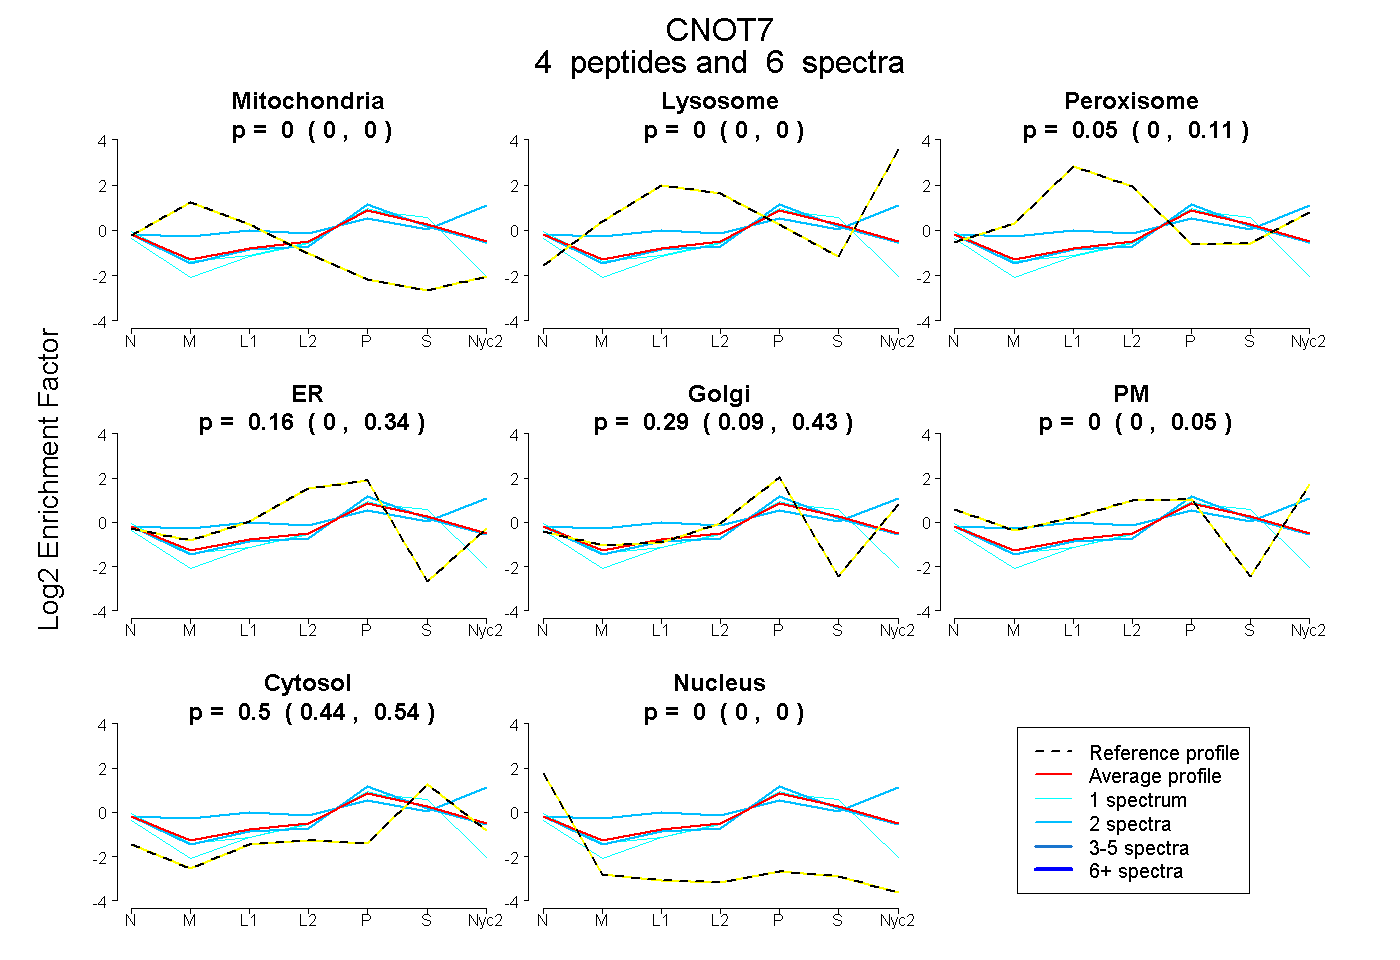
0.000 | 0.001
0.000 | 0.000
0.000 | 0.106
0.000 | 0.340
0.087 | 0.431
0.000 | 0.047
0.441 | 0.542
0.000 | 0.000
1peptide
spectrum
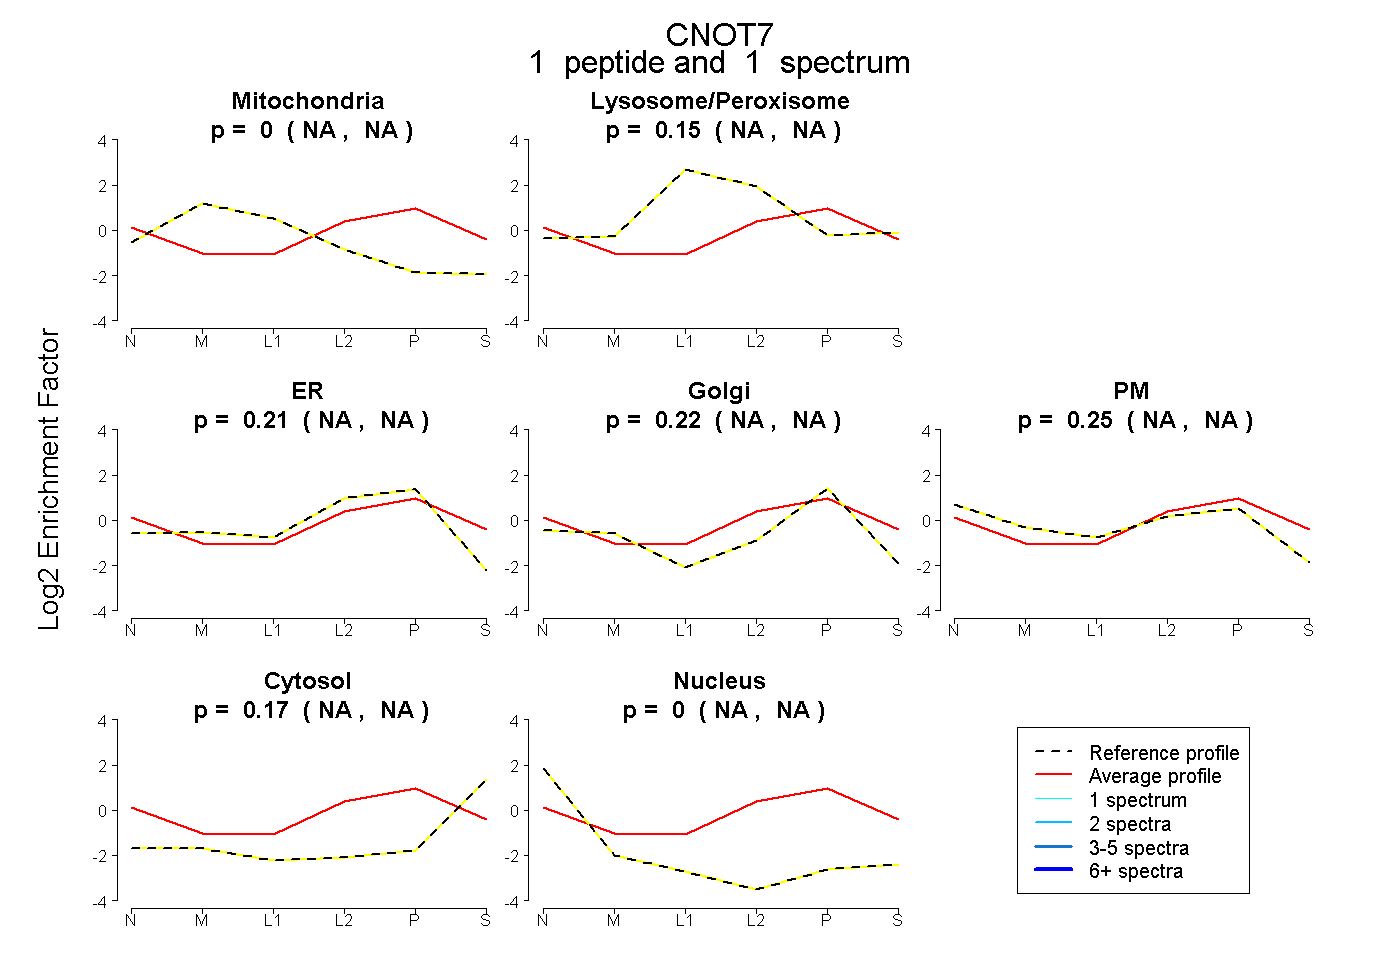
NA | NA
NA | NA
NA | NA
NA | NA
NA | NA
NA | NA
NA | NA
1peptide
spectrum
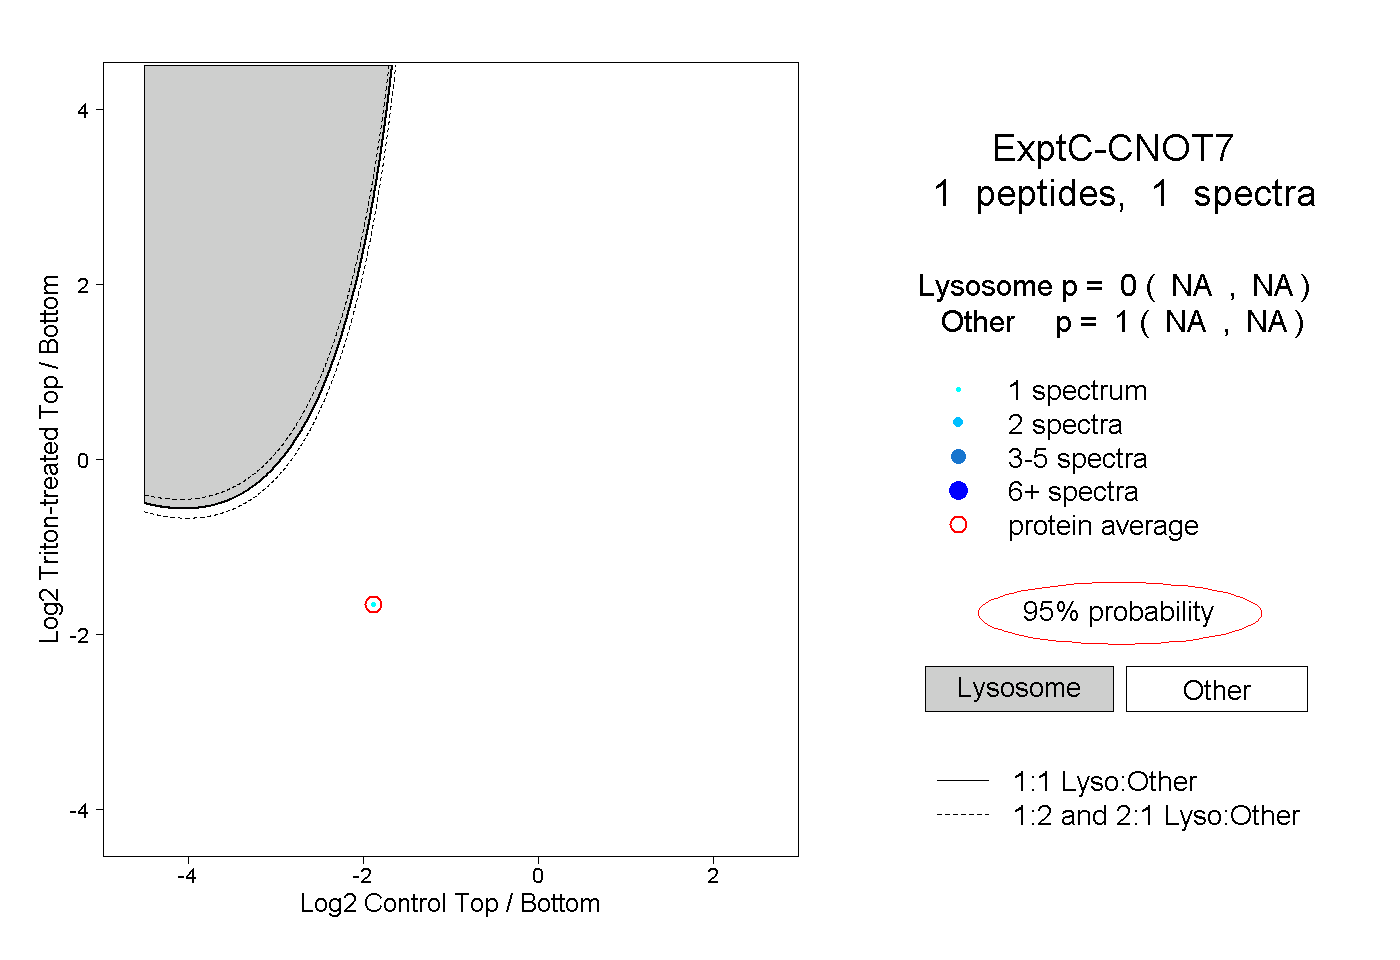
NA | NA
NA | NA
1peptide
spectra
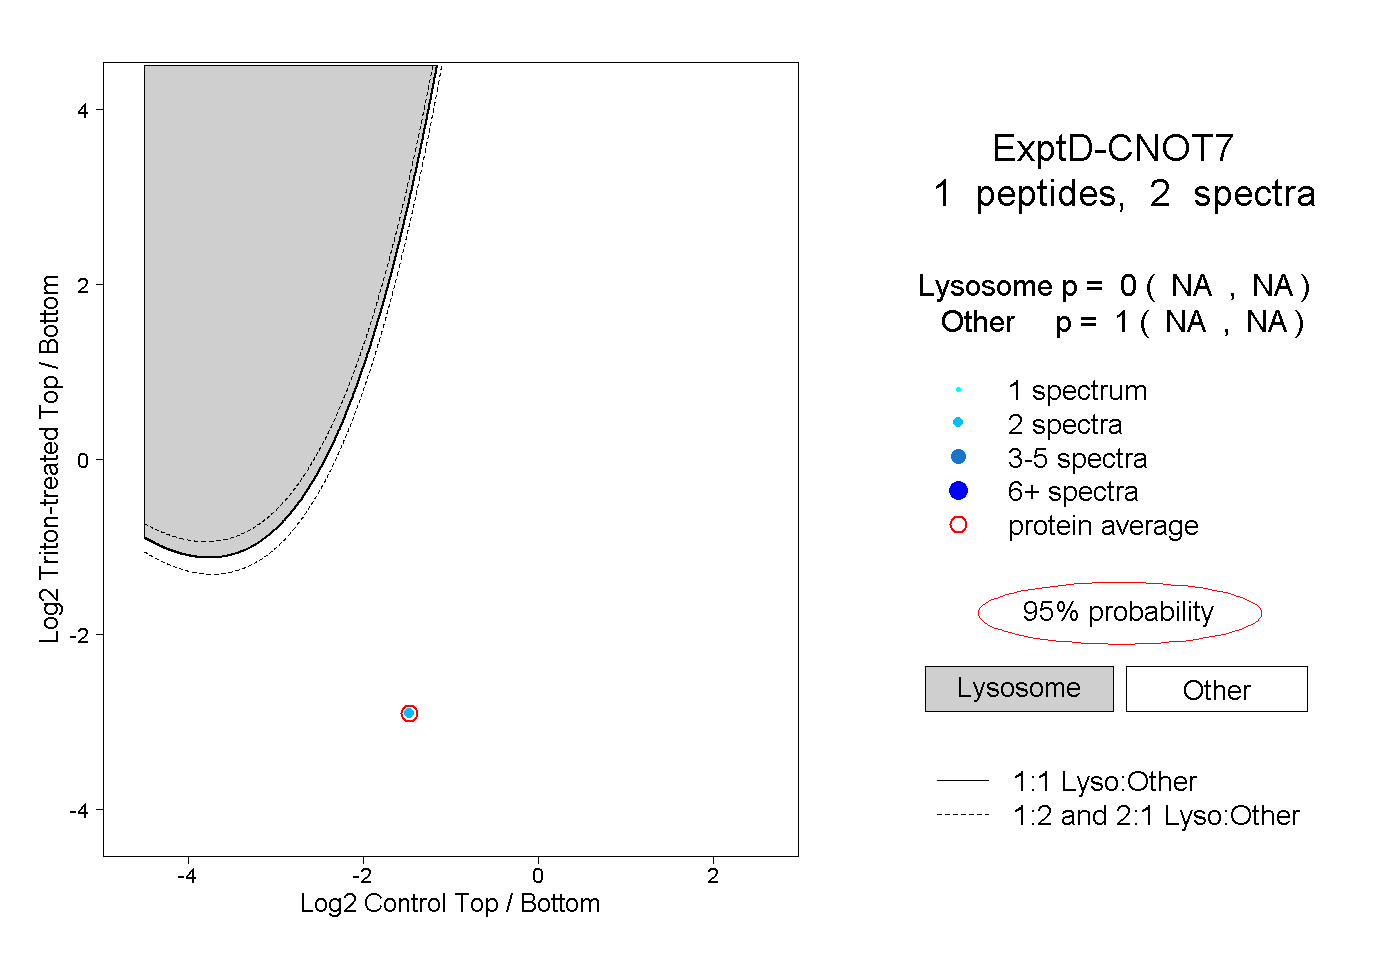
NA | NA
NA | NA