 4
4peptides
spectra
0.000 | 0.001
0.000 | 0.000
0.000 | 0.106
0.000 | 0.340
0.087 | 0.431
0.000 | 0.047
0.441 | 0.542
0.000 | 0.000
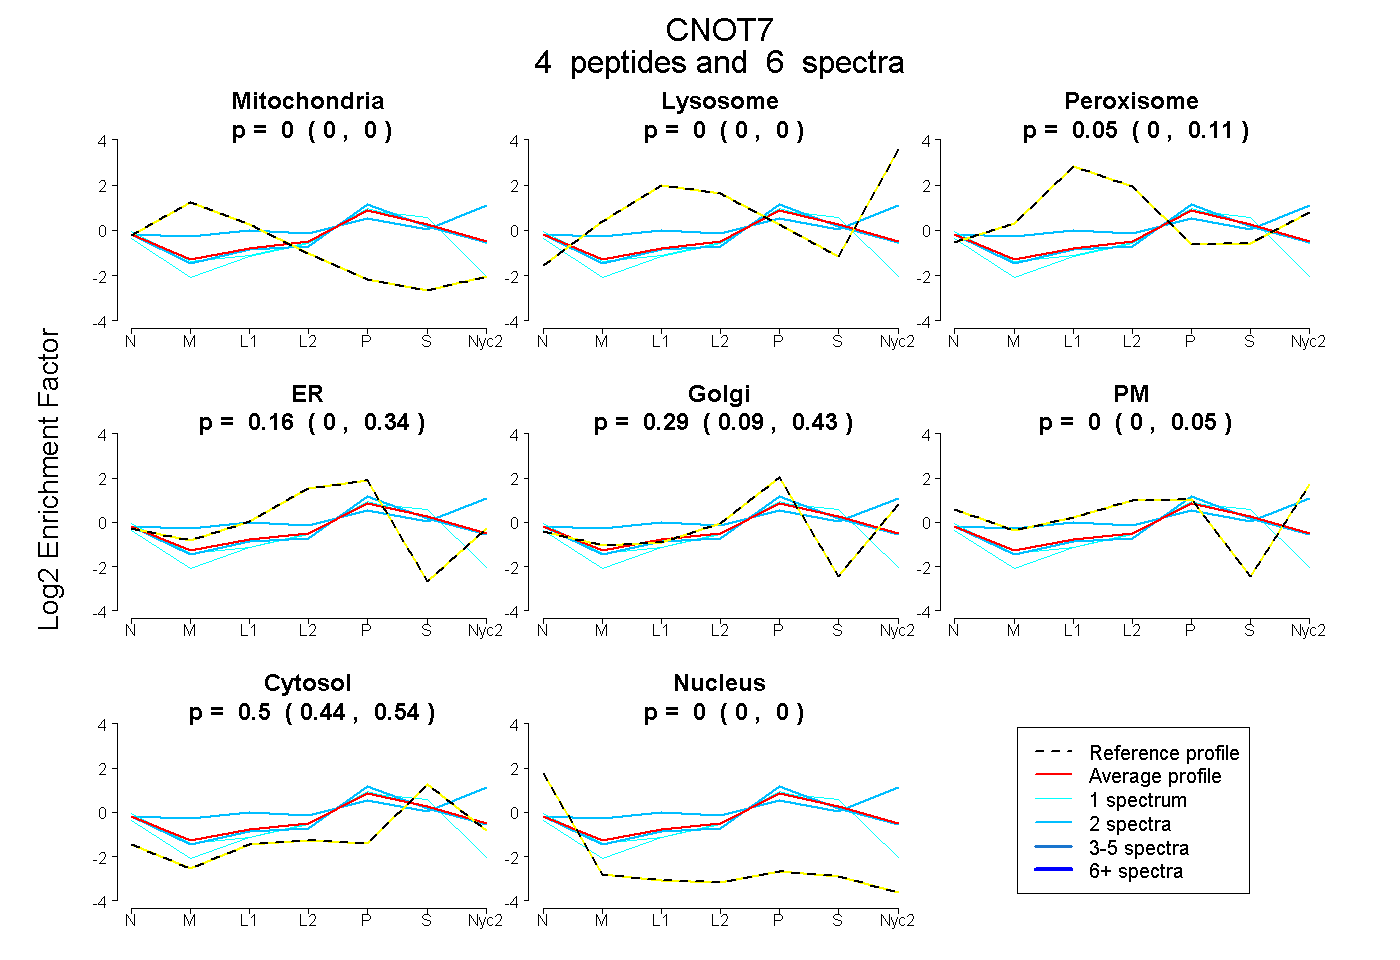
| Plot | Mito | Lyso | Perox | ER | Golgi | PM | Cytosol | Nucleus | |||||
| Expt A |
4 peptides |
6 spectra |
|
0.000 0.000 | 0.001 |
0.000 0.000 | 0.000 |
0.047 0.000 | 0.106 |
0.162 0.000 | 0.340 |
0.294 0.087 | 0.431 |
0.000 0.000 | 0.047 |
0.497 0.441 | 0.542 |
0.000 0.000 | 0.000 |
| 1 spectrum, LFFPVIYDVK | 0.000 | 0.000 | 0.000 | 0.329 | 0.000 | 0.000 | 0.608 | 0.063 | ||
| 2 spectra, CNVDLLK | 0.000 | 0.181 | 0.061 | 0.000 | 0.056 | 0.341 | 0.359 | 0.000 | ||
| 1 spectrum, GGLQEVAEQLELER | 0.000 | 0.000 | 0.000 | 0.170 | 0.318 | 0.000 | 0.512 | 0.000 | ||
| 2 spectra, SNADYQYQLLR | 0.000 | 0.000 | 0.000 | 0.132 | 0.377 | 0.000 | 0.491 | 0.000 |
| Plot | Mito | Lyso or Perox | ER | Golgi | PM | Cytosol | Nucleus | ||||||
| Expt B |
1 peptide |
1 spectrum |
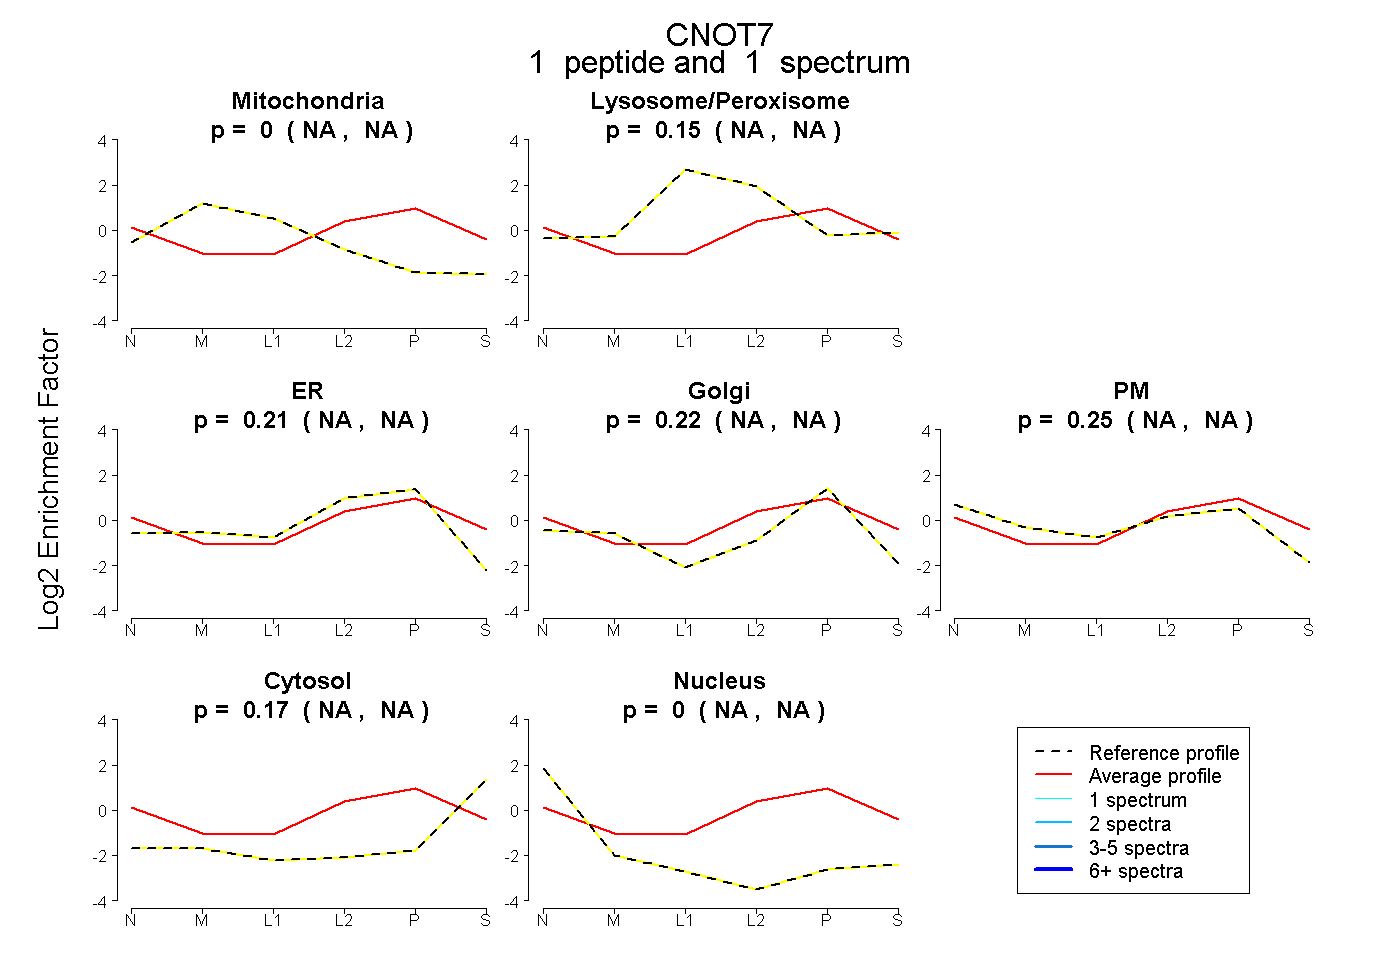 |
0.000 NA | NA |
0.151 NA | NA |
0.209 NA | NA |
0.220 NA | NA |
0.255 NA | NA |
0.165 NA | NA |
0.000 NA | NA |
|||
| Plot | Lyso | Other | |||||||||||
| Expt C |
1 peptide |
1 spectrum |
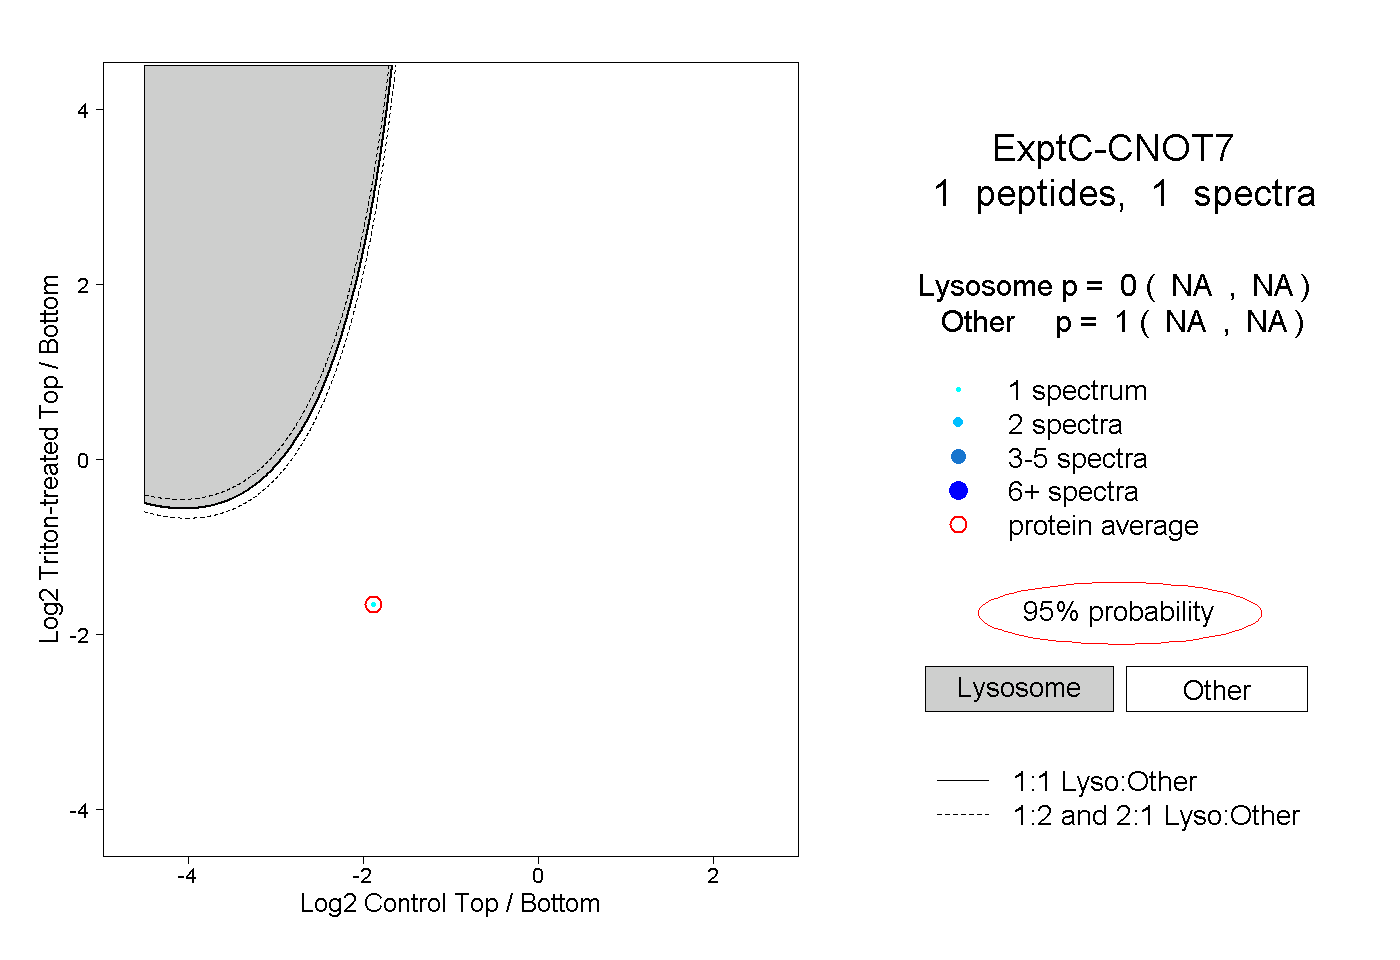 |
0.000 NA | NA |
1.000 NA | NA |
||||||||
| Plot | Lyso | Other | |||||||||||
| Expt D |
1 peptide |
2 spectra |
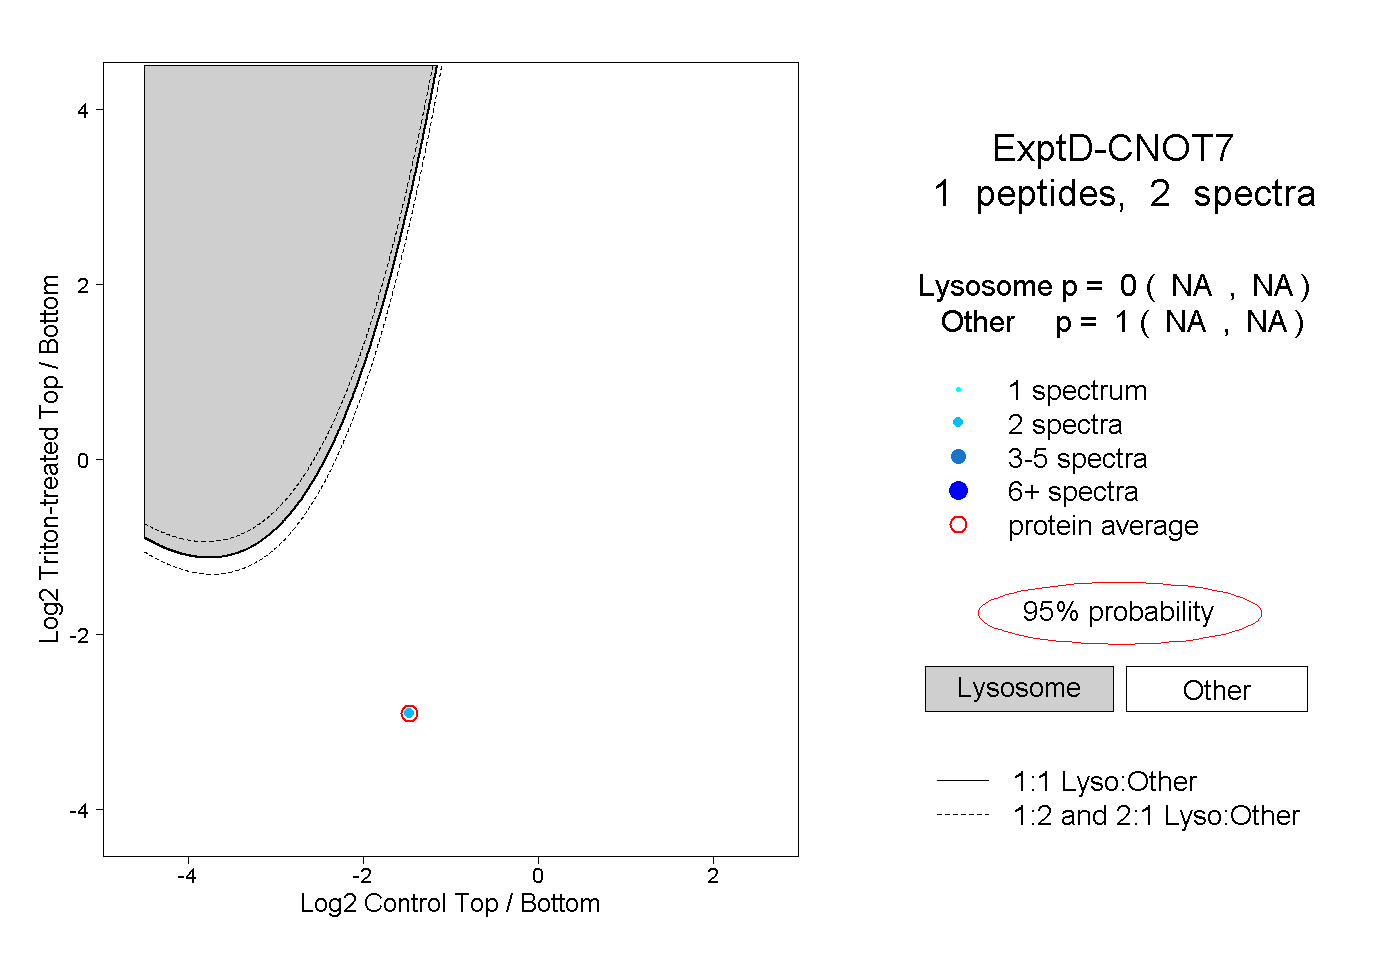 |
0.000 NA | NA |
1.000 NA | NA |