 7
7peptides
spectra
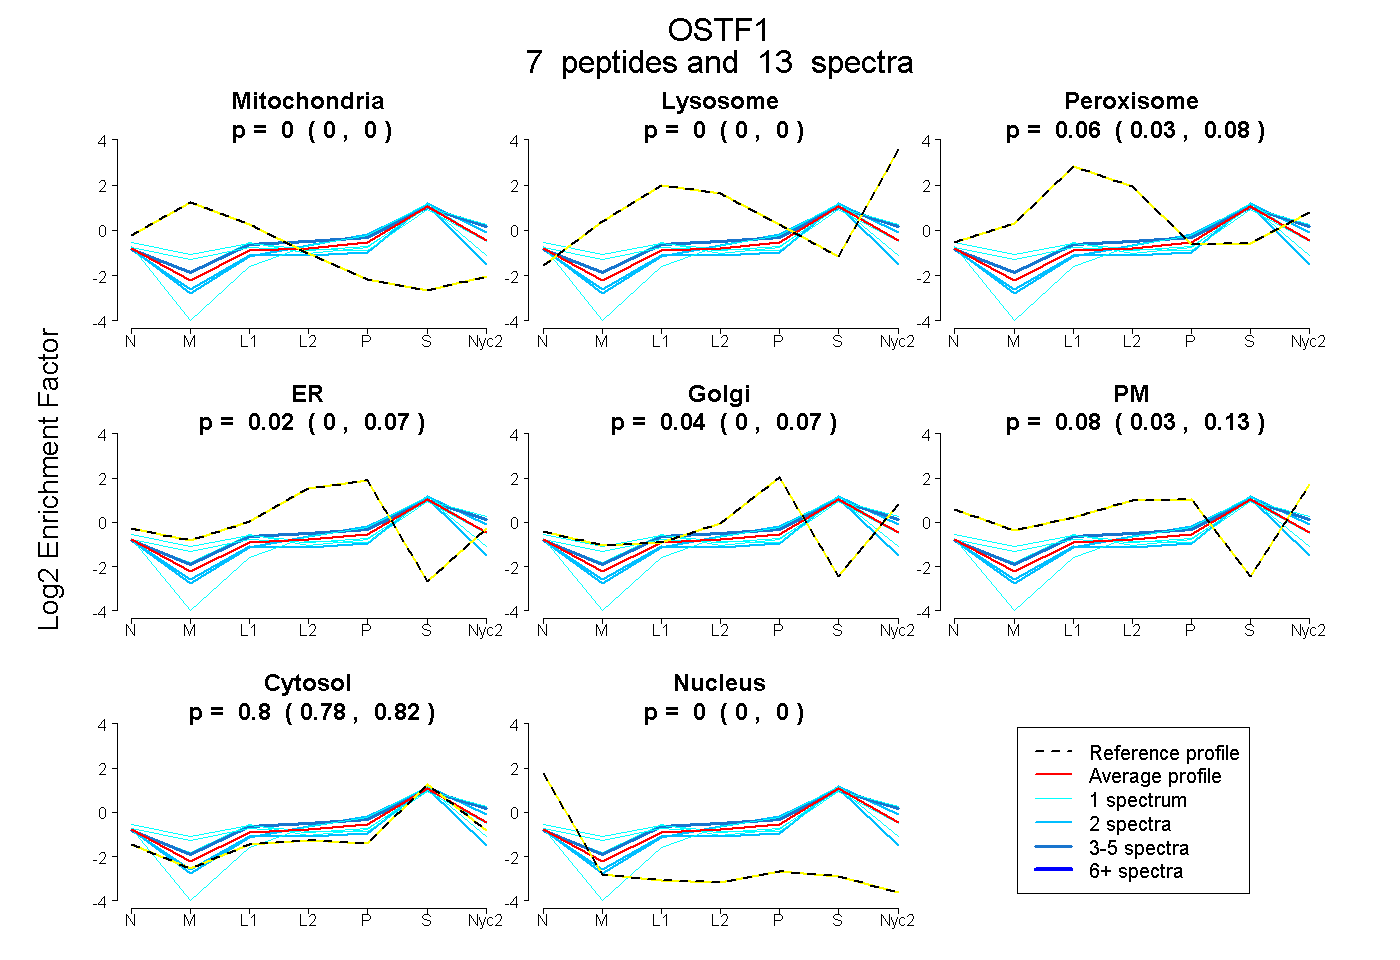
0.000 | 0.000
0.000 | 0.000
0.026 | 0.080
0.000 | 0.073
0.000 | 0.075
0.033 | 0.128
0.781 | 0.819
0.000 | 0.000
2peptides
spectra
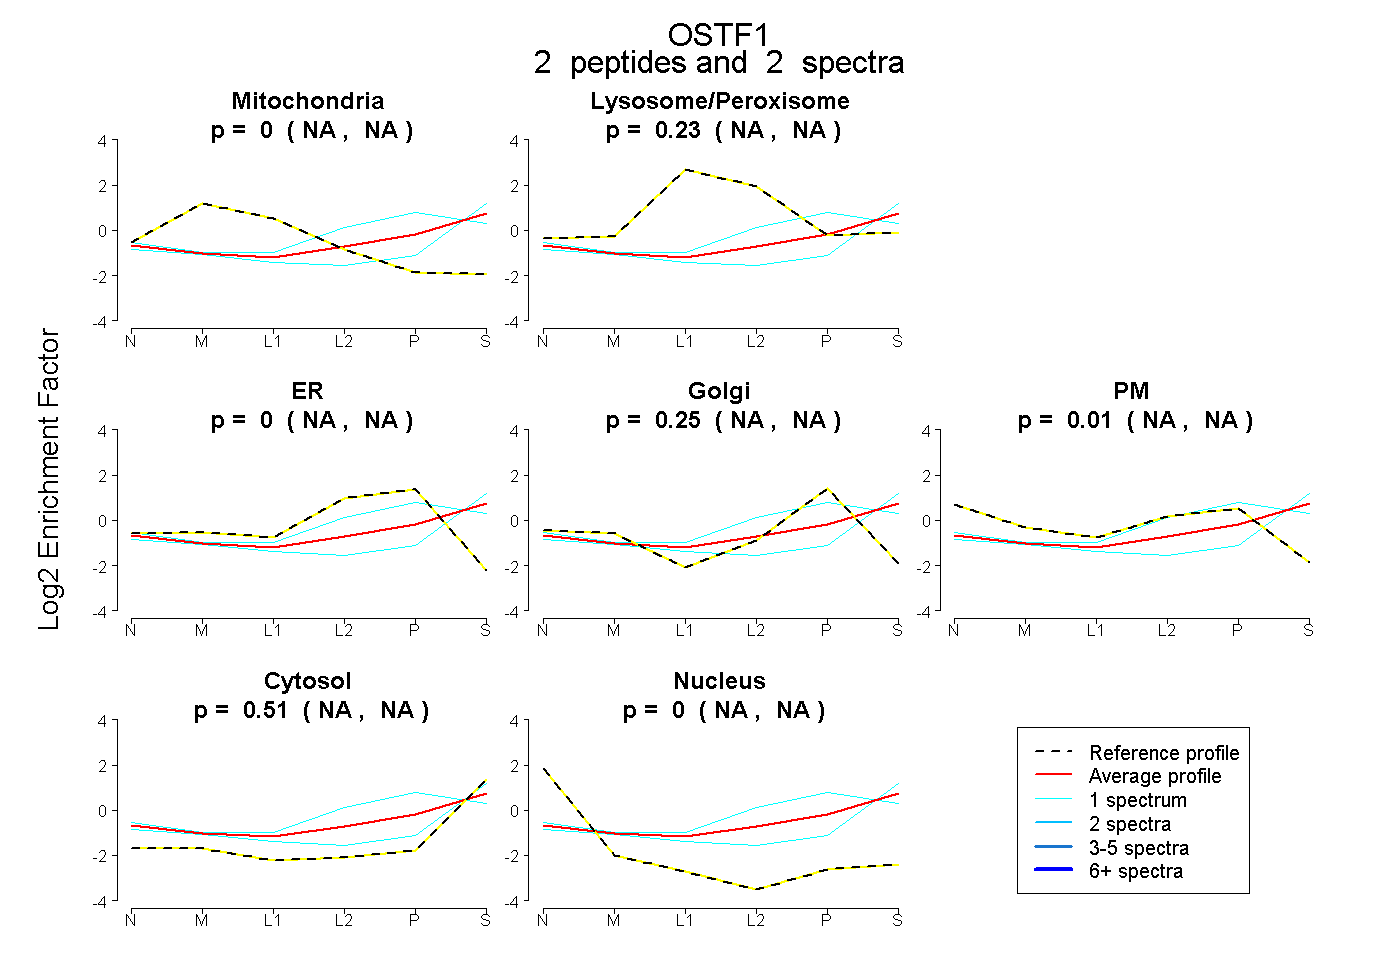
NA | NA
NA | NA
NA | NA
NA | NA
NA | NA
NA | NA
NA | NA
5peptides
spectra
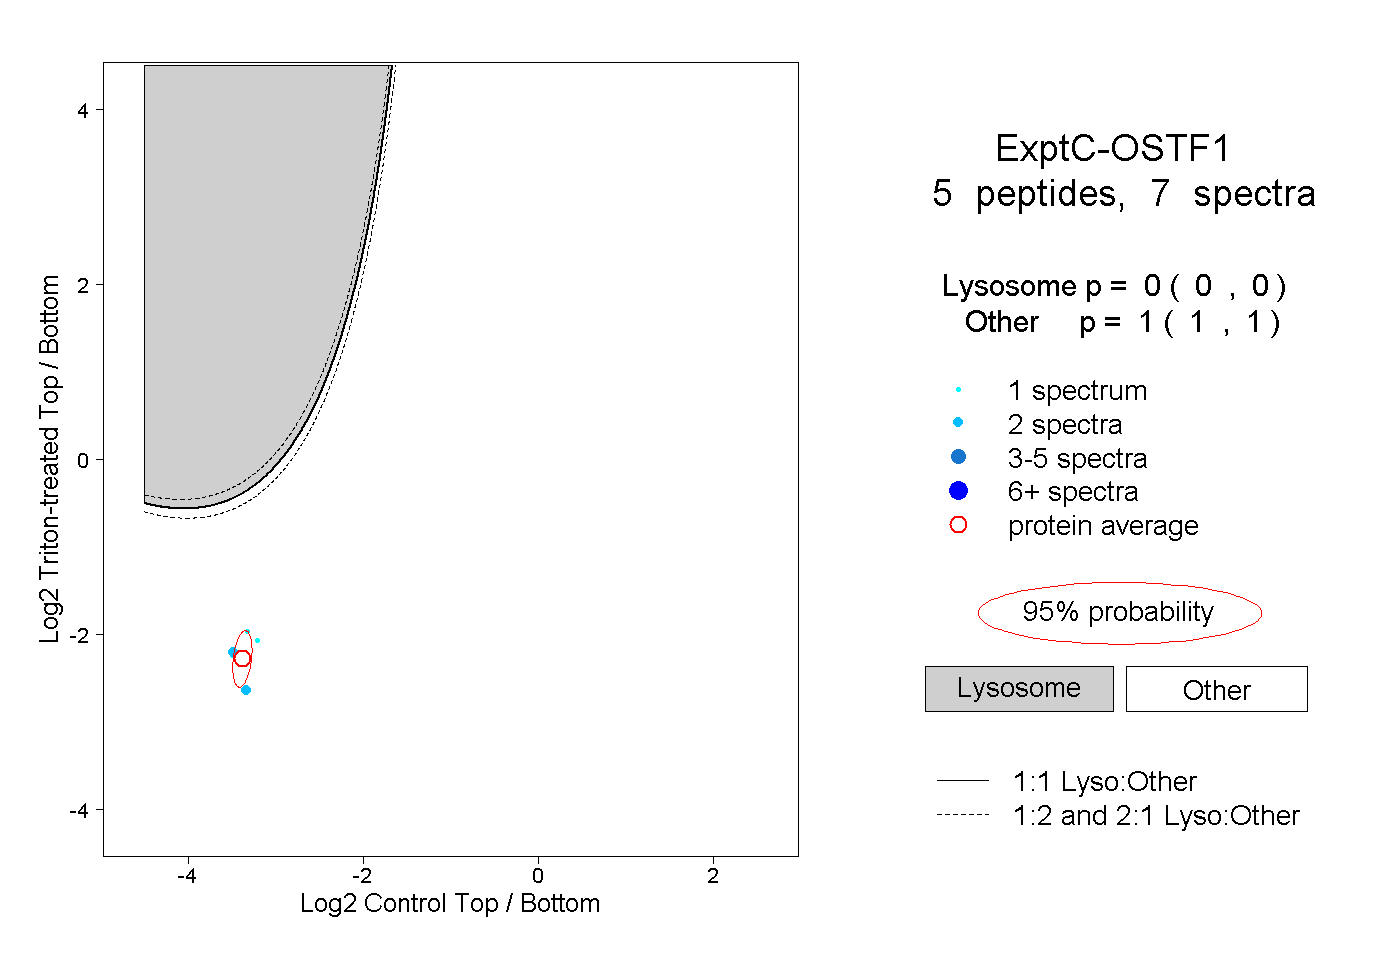
0.000 | 0.000
1.000 | 1.000
1peptide
spectrum
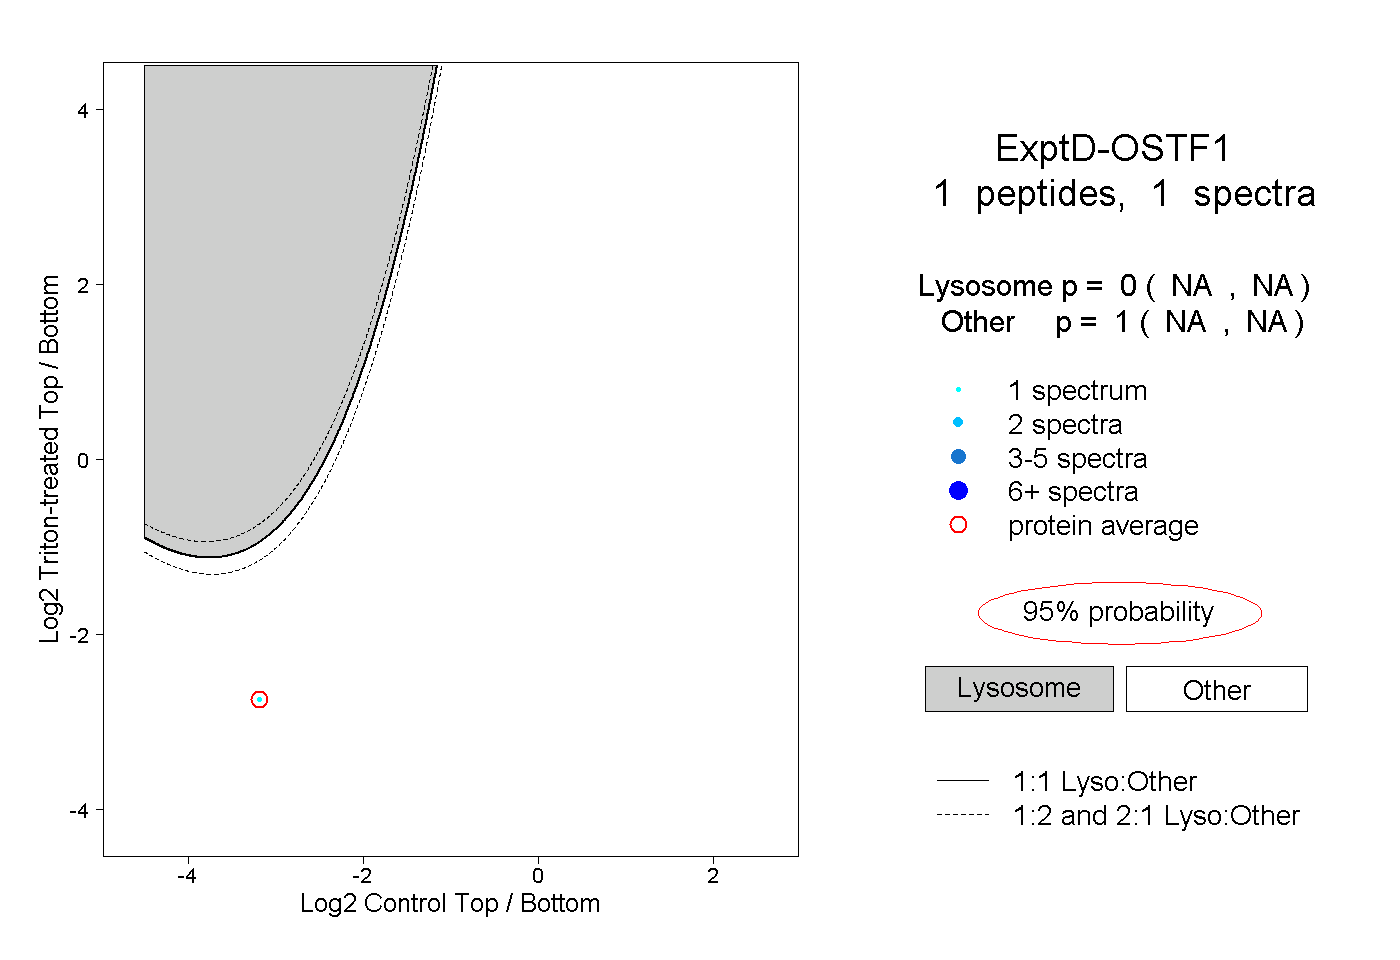
NA | NA
NA | NA