 7
7peptides
spectra
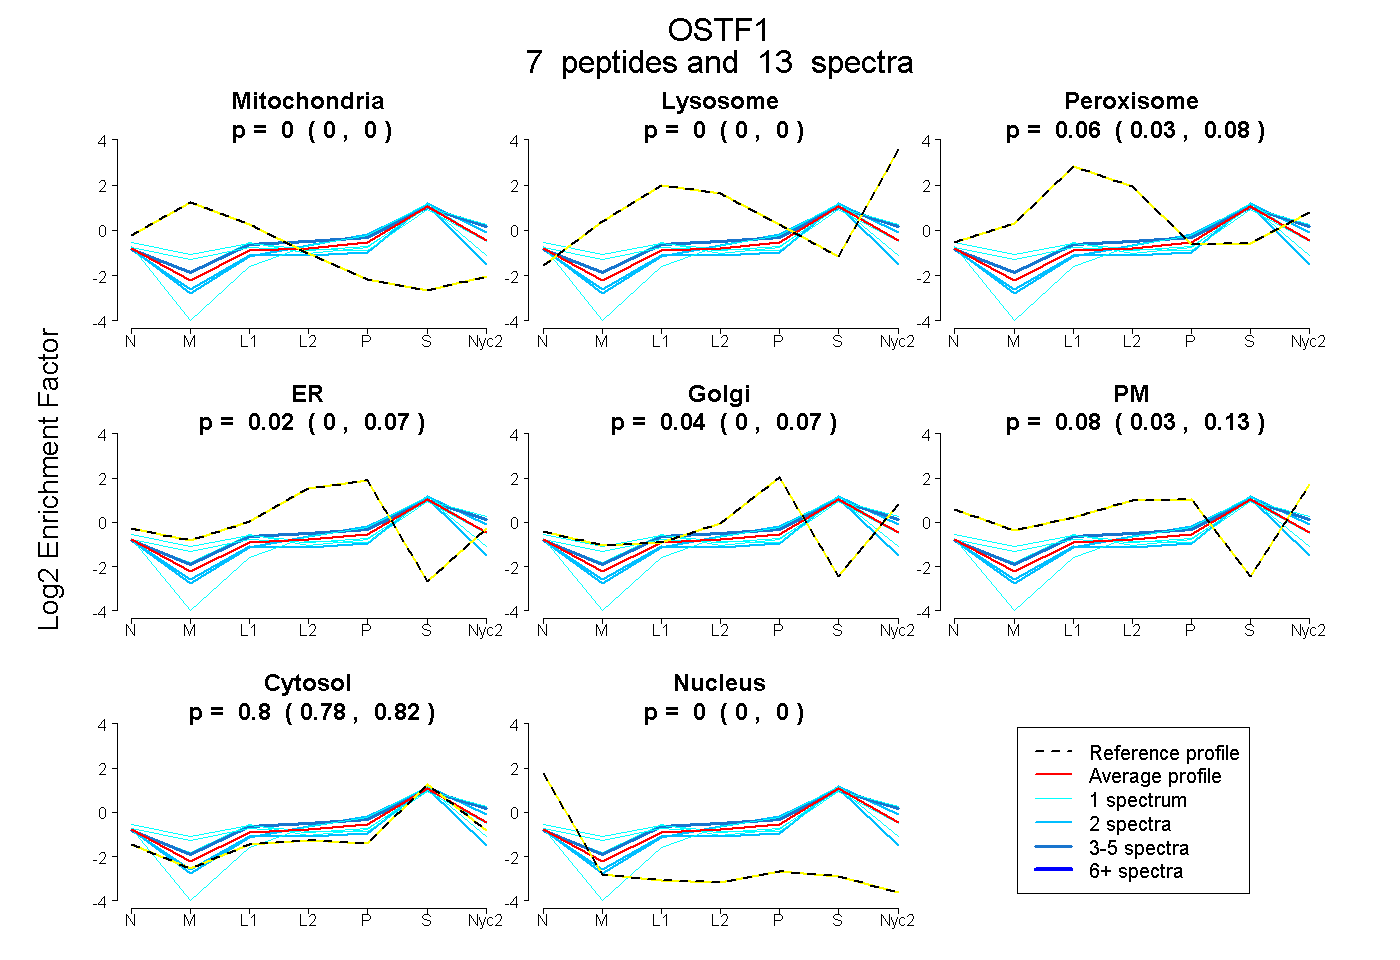
0.000 | 0.000
0.000 | 0.000
0.026 | 0.080
0.000 | 0.073
0.000 | 0.075
0.033 | 0.128
0.781 | 0.819
0.000 | 0.000
| Plot | Mito | Lyso | Perox | ER | Golgi | PM | Cytosol | Nucleus | |||||
| Expt A |
7 peptides |
13 spectra |
|
0.000 0.000 | 0.000 |
0.000 0.000 | 0.000 |
0.057 0.026 | 0.080 |
0.021 0.000 | 0.073 |
0.037 0.000 | 0.075 |
0.084 0.033 | 0.128 |
0.801 0.781 | 0.819 |
0.000 0.000 | 0.000 |
| 1 spectrum, LALDMATNAACASLLK | 0.000 | 0.000 | 0.000 | 0.000 | 0.121 | 0.000 | 0.879 | 0.000 | ||
| 2 spectra, ALYTFEPR | 0.000 | 0.024 | 0.000 | 0.000 | 0.000 | 0.098 | 0.878 | 0.000 | ||
| 1 spectrum, GYADIVQLLLAK | 0.003 | 0.146 | 0.012 | 0.000 | 0.000 | 0.110 | 0.729 | 0.000 | ||
| 1 spectrum, LGDTALHAAAWK | 0.087 | 0.000 | 0.153 | 0.000 | 0.000 | 0.076 | 0.684 | 0.000 | ||
| 2 spectra, ECLDNR | 0.000 | 0.000 | 0.000 | 0.165 | 0.000 | 0.000 | 0.823 | 0.012 | ||
| 5 spectra, GNLSWLR | 0.000 | 0.111 | 0.038 | 0.000 | 0.023 | 0.114 | 0.714 | 0.000 | ||
| 1 spectrum, AGSTALYWACHGGHK | 0.026 | 0.000 | 0.138 | 0.032 | 0.000 | 0.000 | 0.786 | 0.018 |
| Plot | Mito | Lyso or Perox | ER | Golgi | PM | Cytosol | Nucleus | ||||||
| Expt B |
2 peptides |
2 spectra |
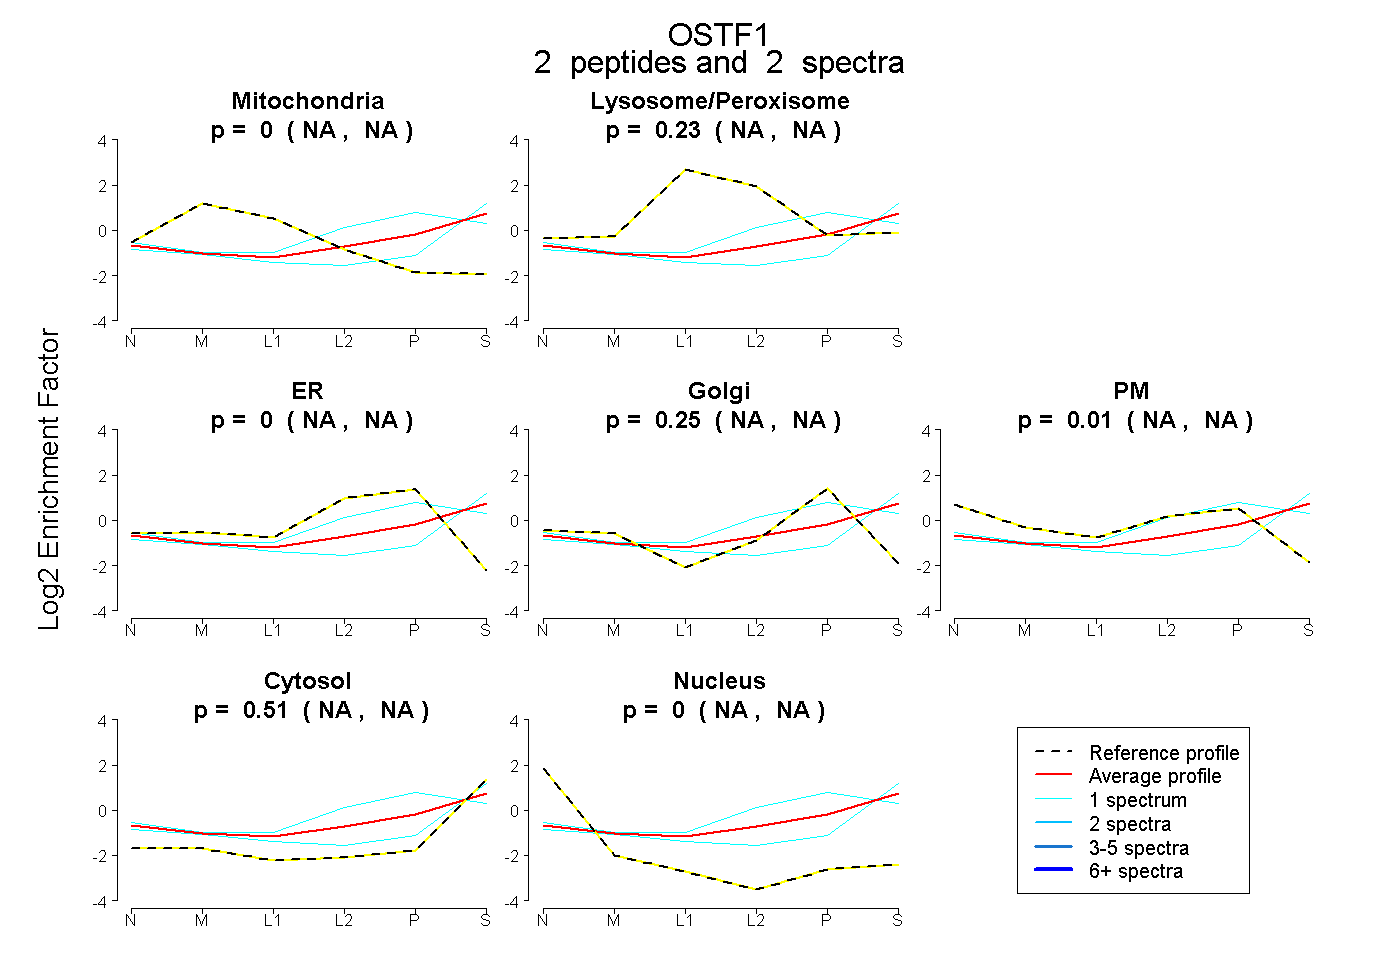 |
0.000 NA | NA |
0.232 NA | NA |
0.000 NA | NA |
0.251 NA | NA |
0.012 NA | NA |
0.505 NA | NA |
0.000 NA | NA |
|||
| Plot | Lyso | Other | |||||||||||
| Expt C |
5 peptides |
7 spectra |
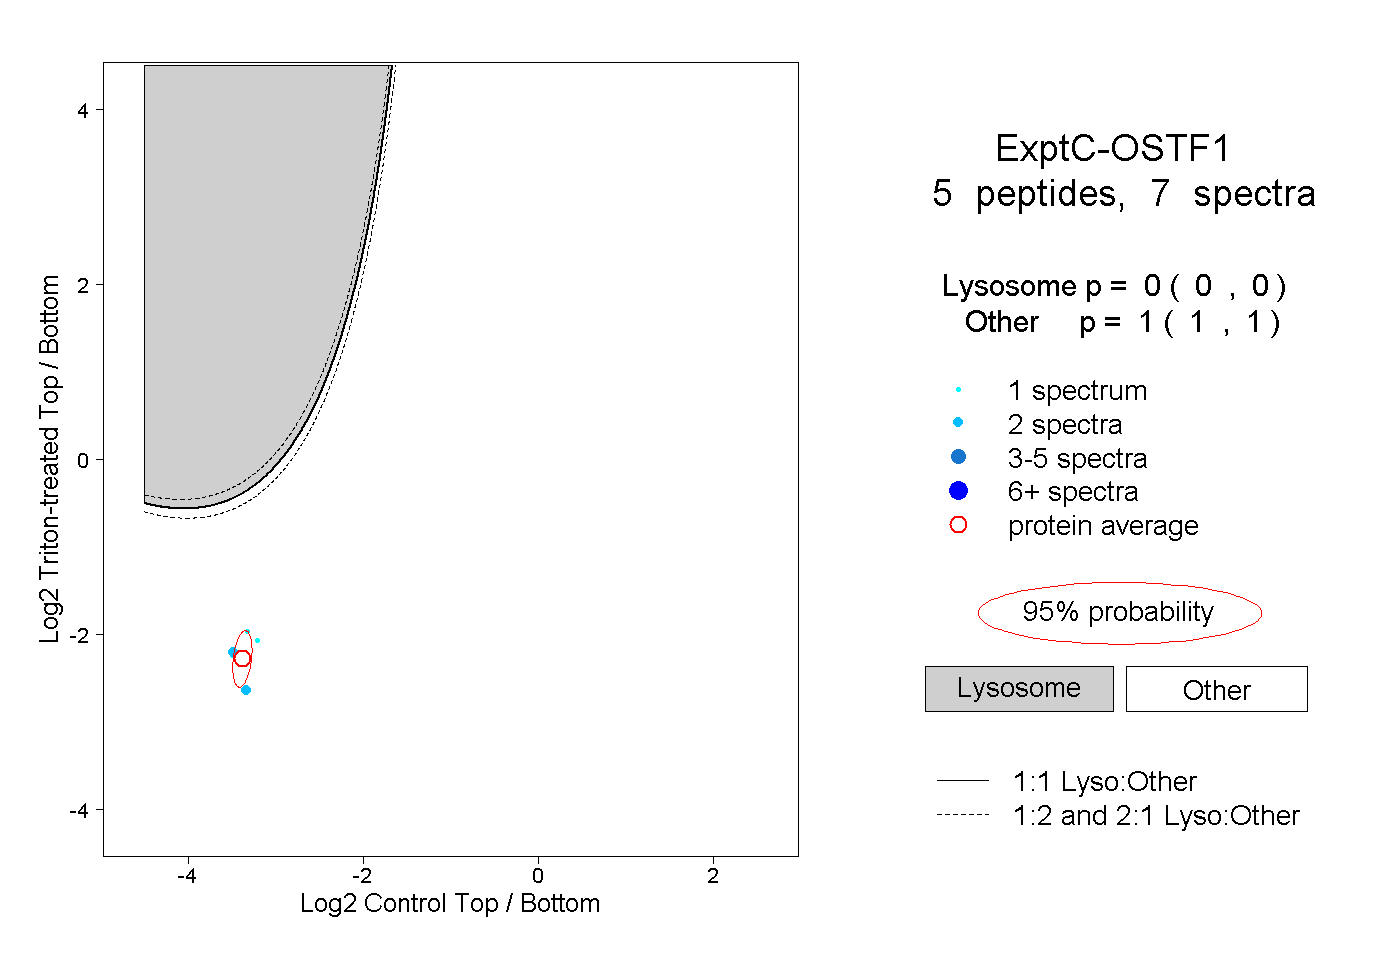 |
0.000 0.000 | 0.000 |
1.000 1.000 | 1.000 |
||||||||
| Plot | Lyso | Other | |||||||||||
| Expt D |
1 peptide |
1 spectrum |
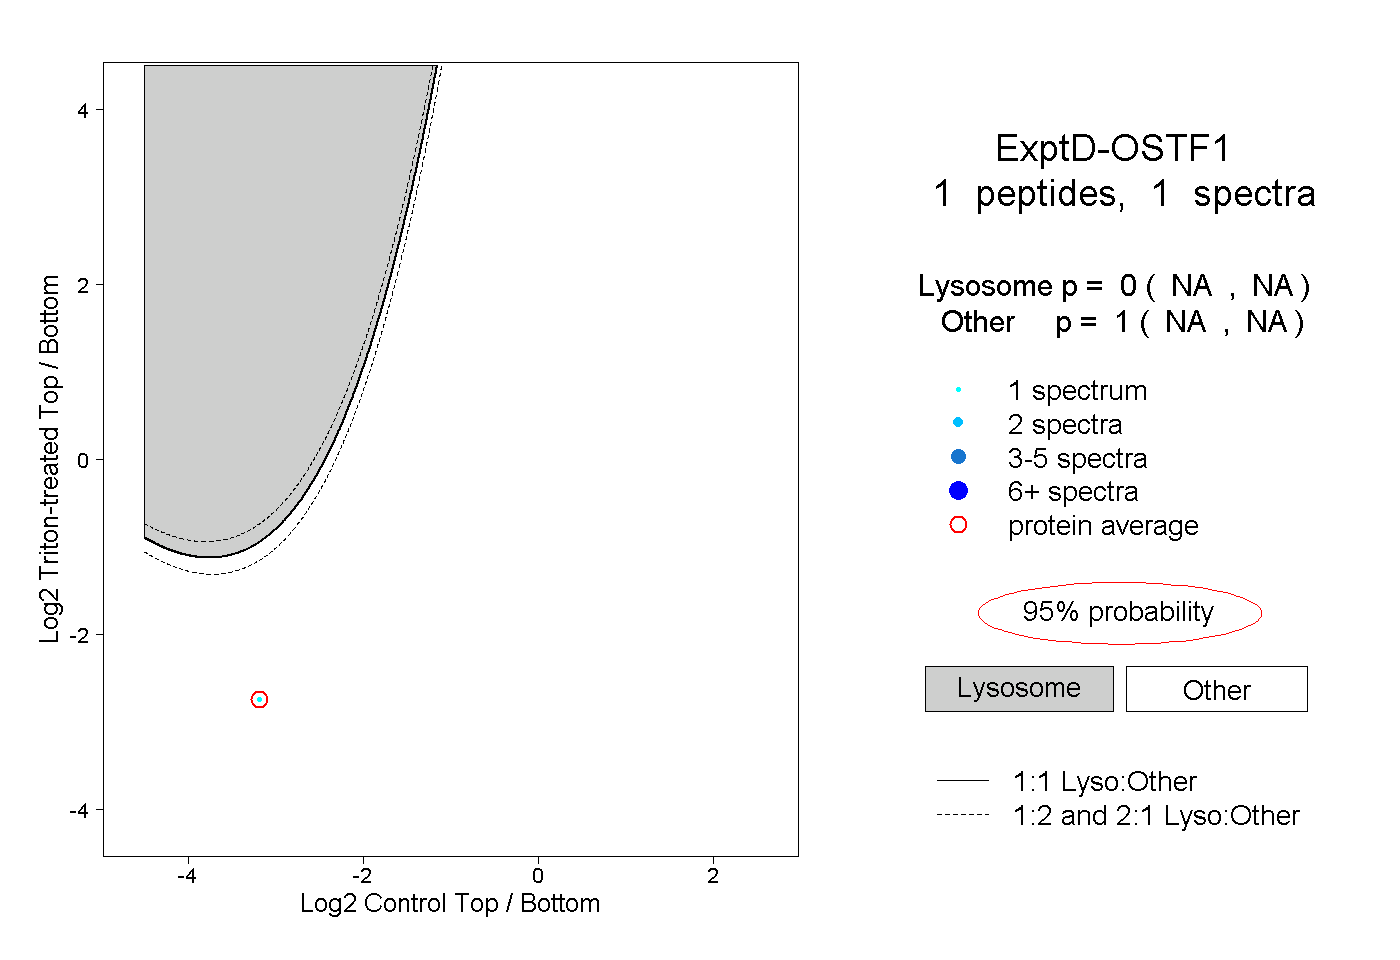 |
0.000 NA | NA |
1.000 NA | NA |