 3
3peptides
spectra
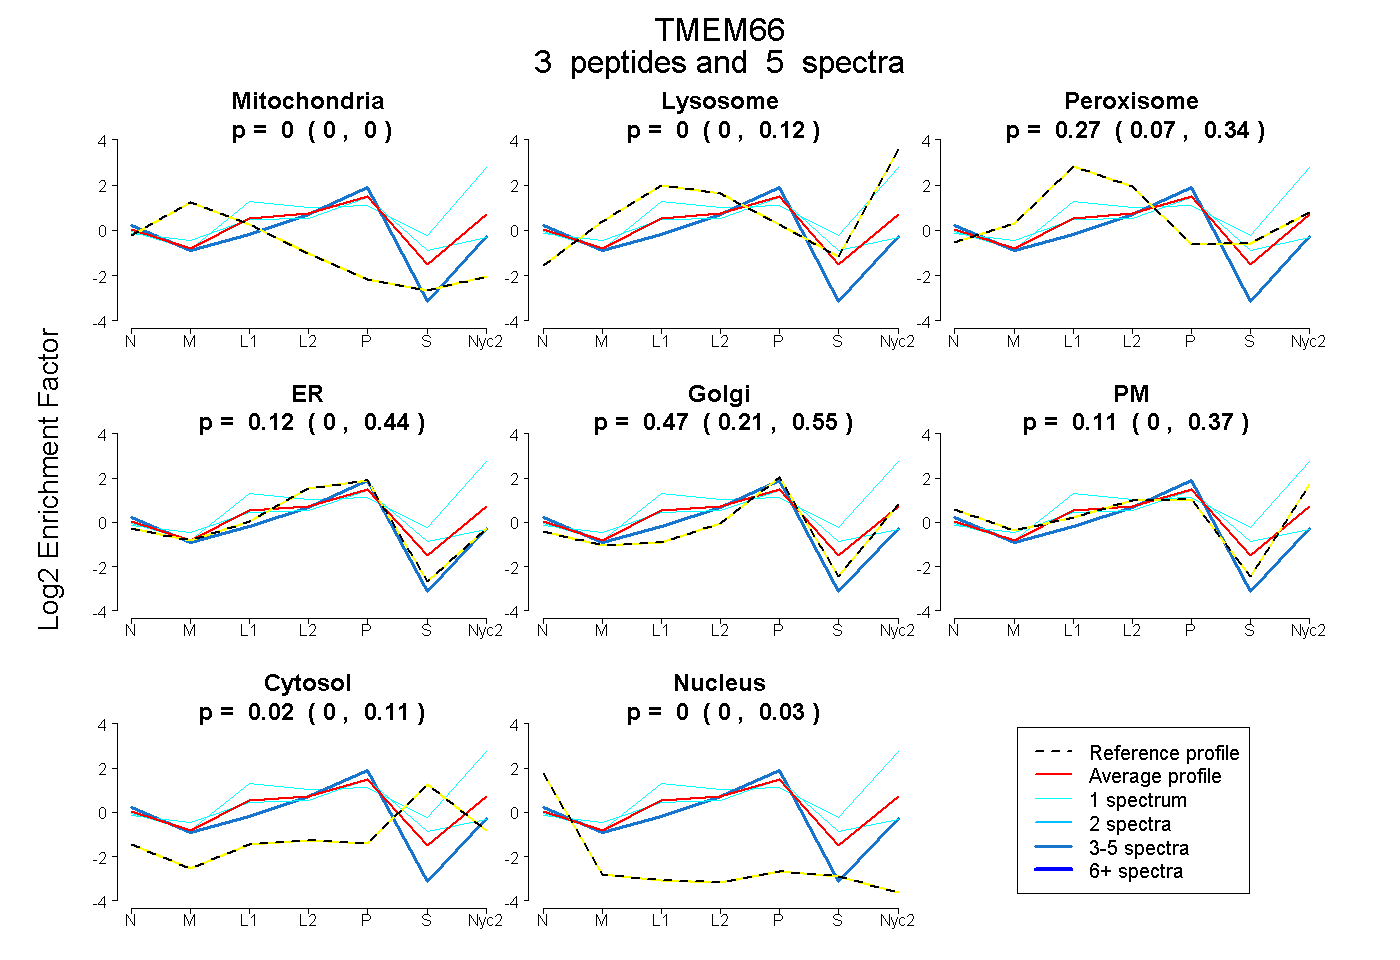
0.000 | 0.000
0.000 | 0.122
0.072 | 0.343
0.000 | 0.437
0.208 | 0.547
0.000 | 0.367
0.000 | 0.110
0.000 | 0.029
1peptide
spectrum
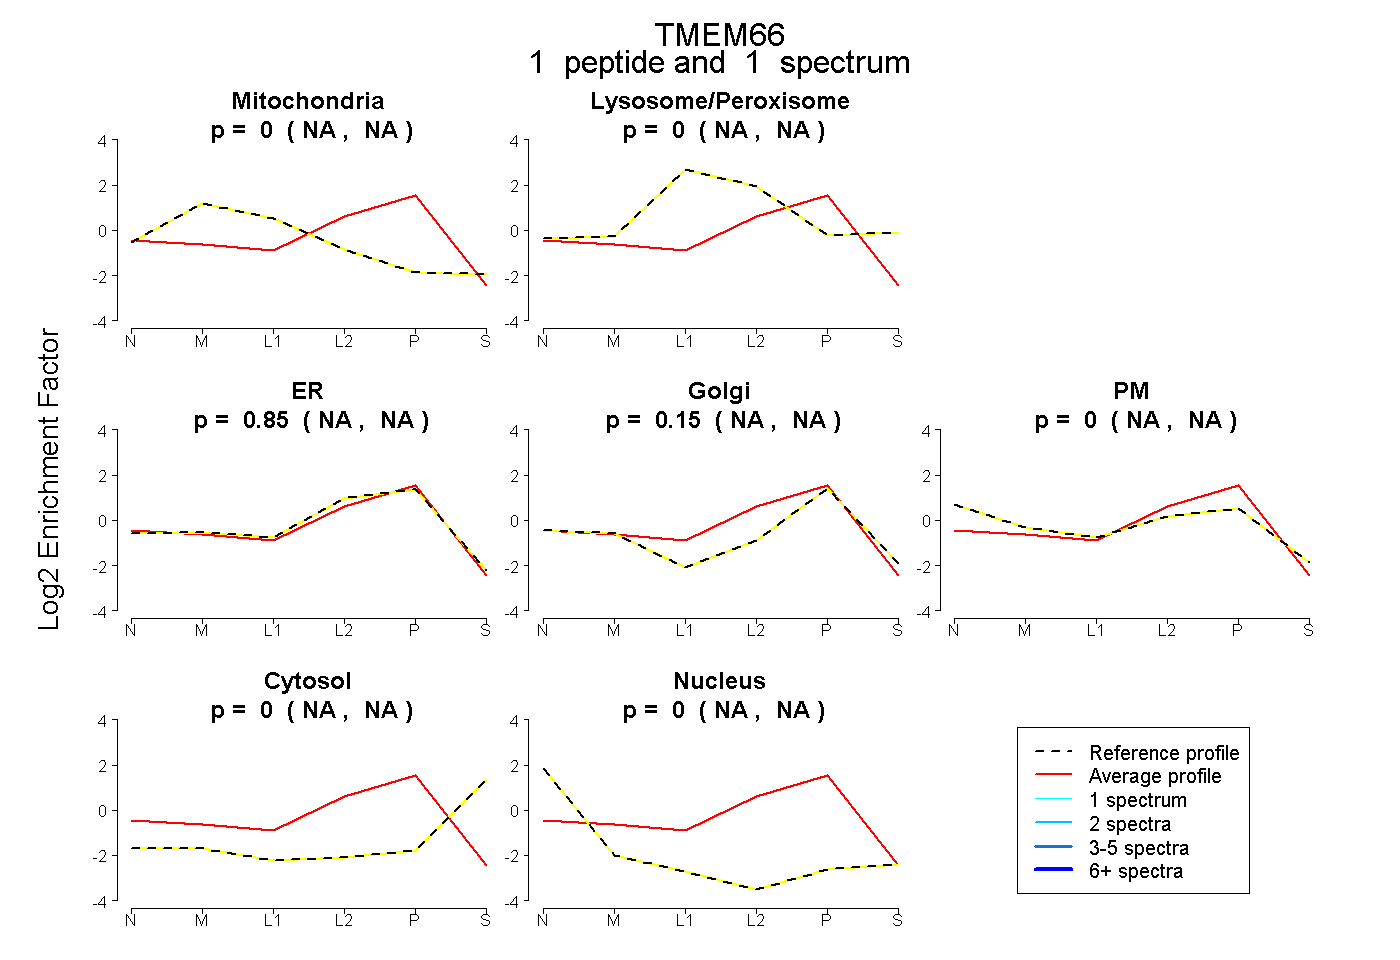
NA | NA
NA | NA
NA | NA
NA | NA
NA | NA
NA | NA
NA | NA
1peptide
spectra
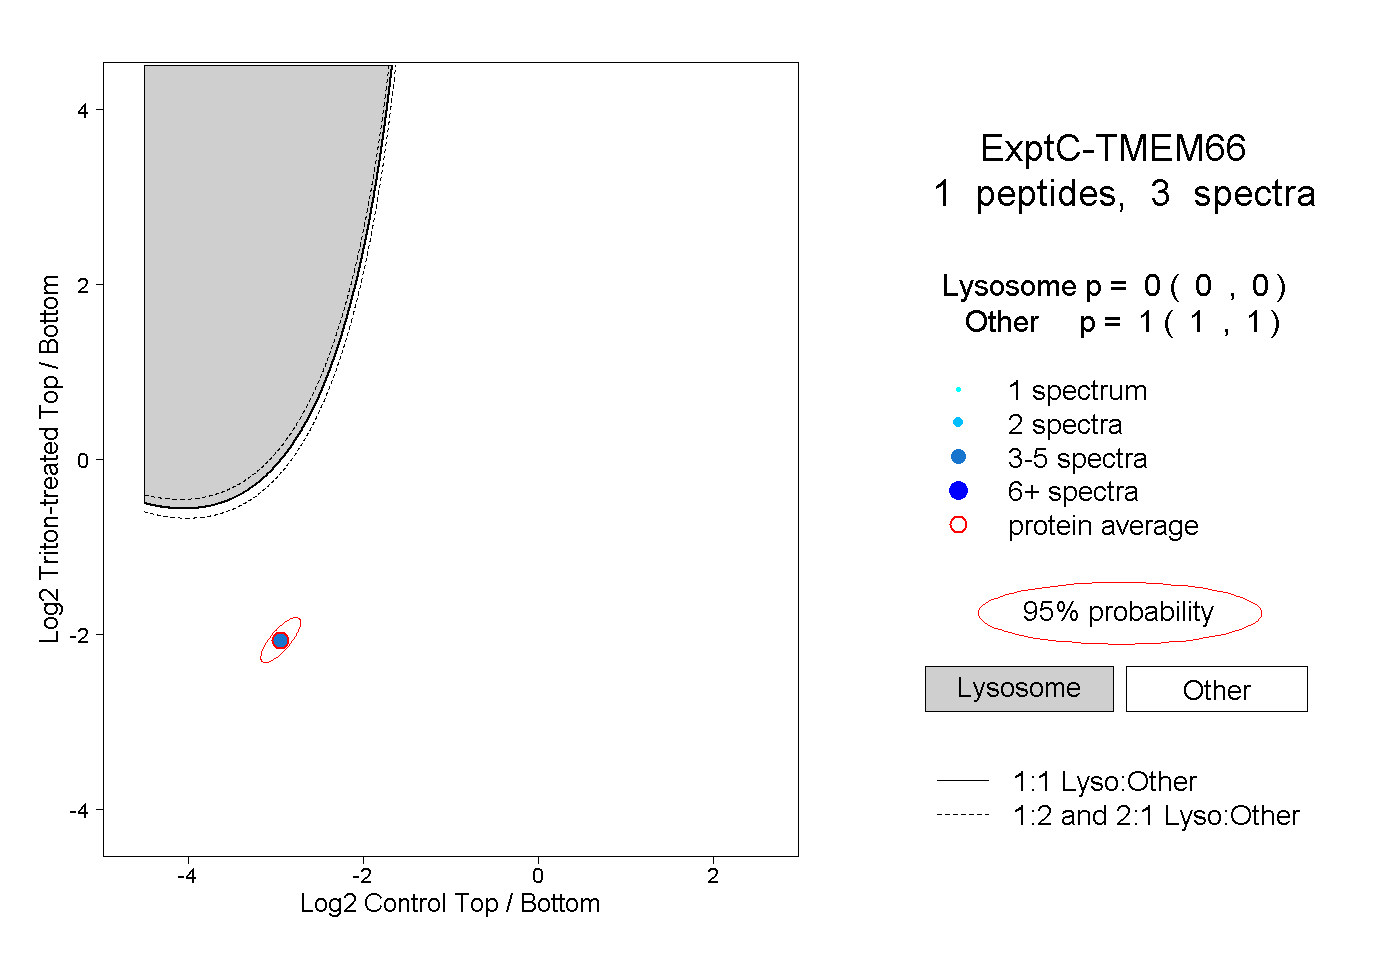
0.000 | 0.000
1.000 | 1.000