 3
3peptides
spectra
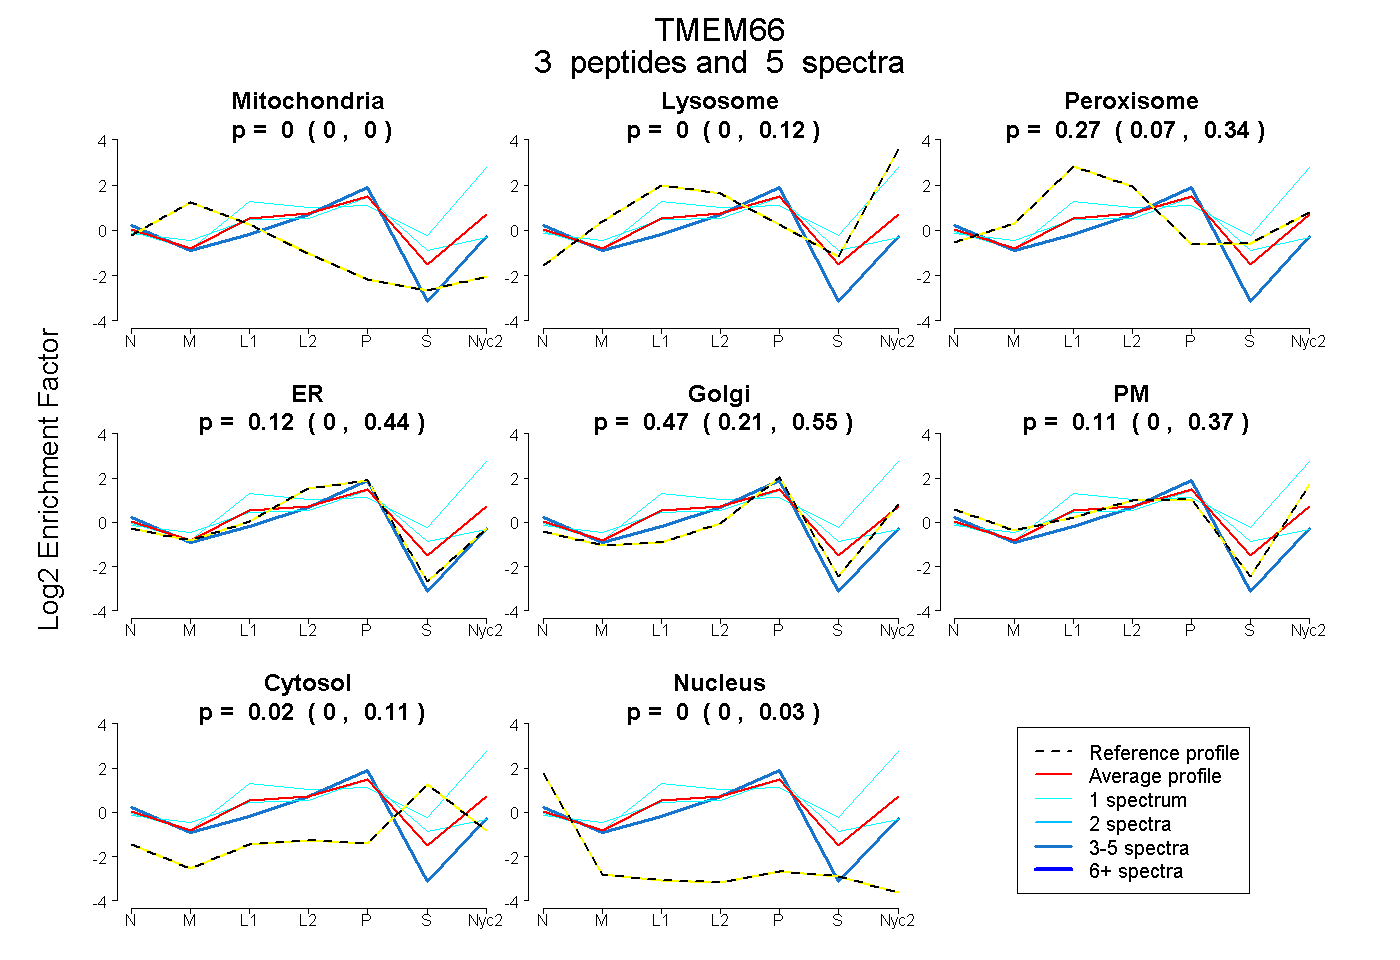
0.000 | 0.000
0.000 | 0.122
0.072 | 0.343
0.000 | 0.437
0.208 | 0.547
0.000 | 0.367
0.000 | 0.110
0.000 | 0.029
| Plot | Mito | Lyso | Perox | ER | Golgi | PM | Cytosol | Nucleus | |||||
| Expt A |
3 peptides |
5 spectra |
|
0.000 0.000 | 0.000 |
0.000 0.000 | 0.122 |
0.271 0.072 | 0.343 |
0.123 0.000 | 0.437 |
0.474 0.208 | 0.547 |
0.111 0.000 | 0.367 |
0.020 0.000 | 0.110 |
0.000 0.000 | 0.029 |
| 1 spectrum, CVGGTAGCDAYTPK | 0.000 | 0.540 | 0.000 | 0.000 | 0.000 | 0.330 | 0.131 | 0.000 | ||
| 3 spectra, DVEALTLYSDR | 0.000 | 0.000 | 0.000 | 0.700 | 0.181 | 0.050 | 0.000 | 0.070 | ||
| 1 spectrum, GWDGYDVQWECK | 0.000 | 0.000 | 0.233 | 0.407 | 0.199 | 0.000 | 0.161 | 0.000 |
| Plot | Mito | Lyso or Perox | ER | Golgi | PM | Cytosol | Nucleus | ||||||
| Expt B |
1 peptide |
1 spectrum |
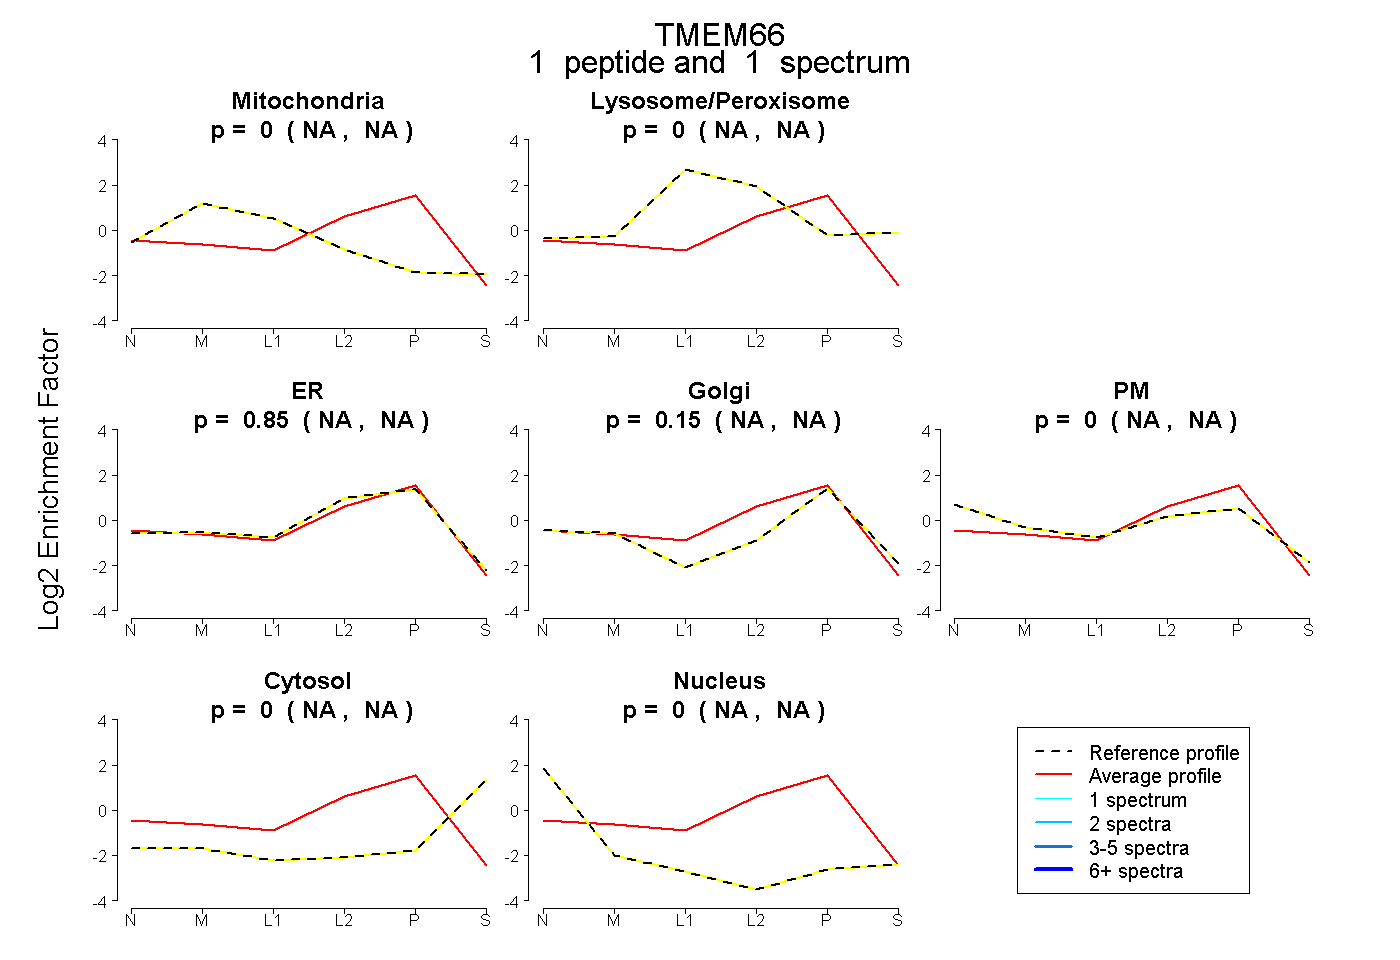 |
0.000 NA | NA |
0.000 NA | NA |
0.851 NA | NA |
0.145 NA | NA |
0.000 NA | NA |
0.000 NA | NA |
0.003 NA | NA |
|||
| Plot | Lyso | Other | |||||||||||
| Expt C |
1 peptide |
3 spectra |
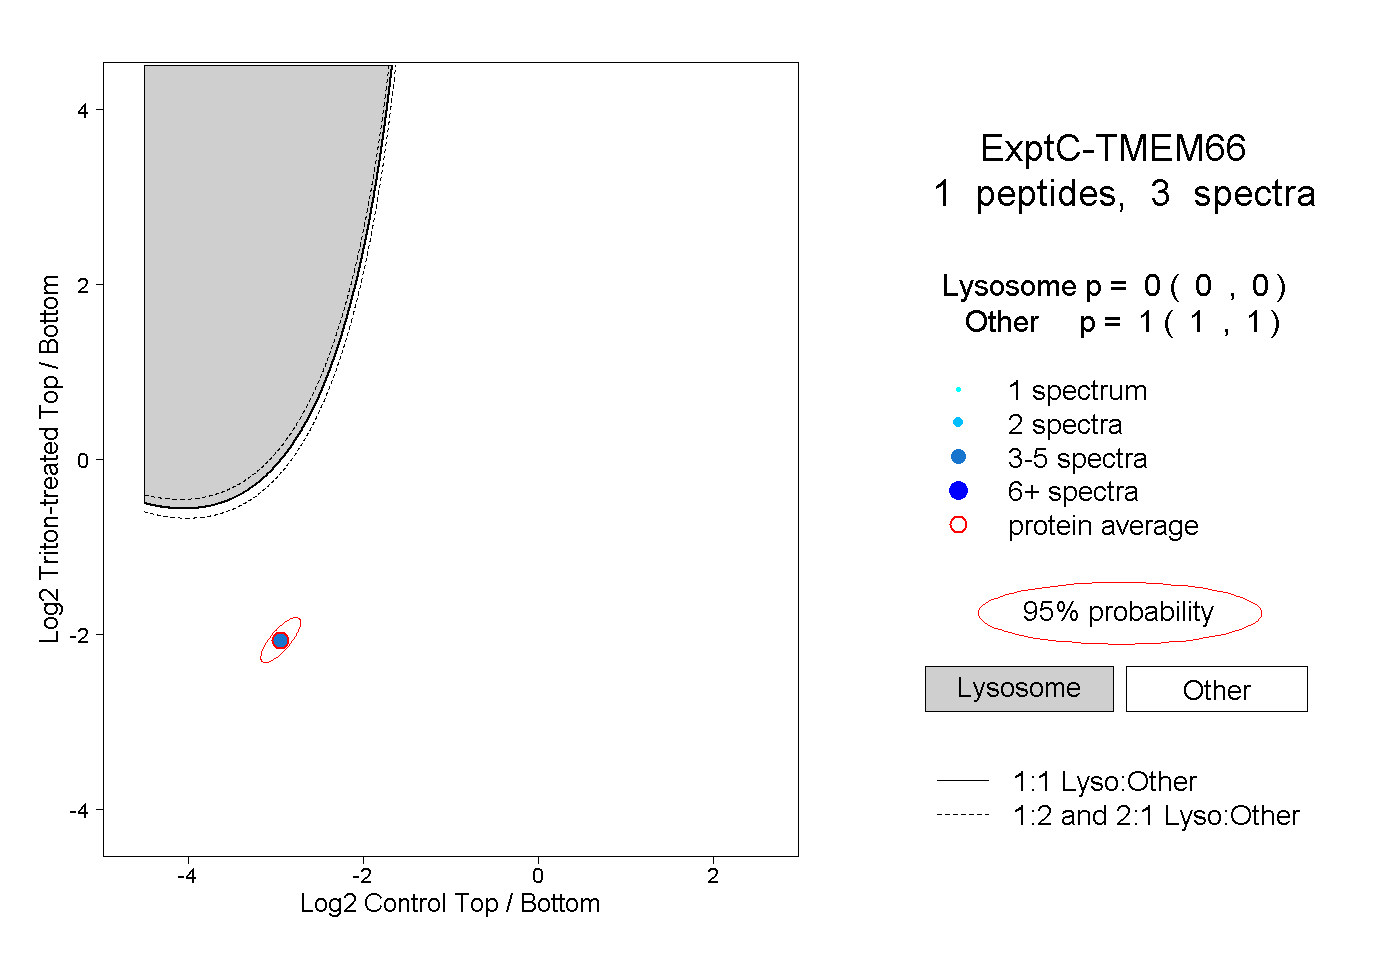 |
0.000 0.000 | 0.000 |
1.000 1.000 | 1.000 |