 7
7peptides
spectra
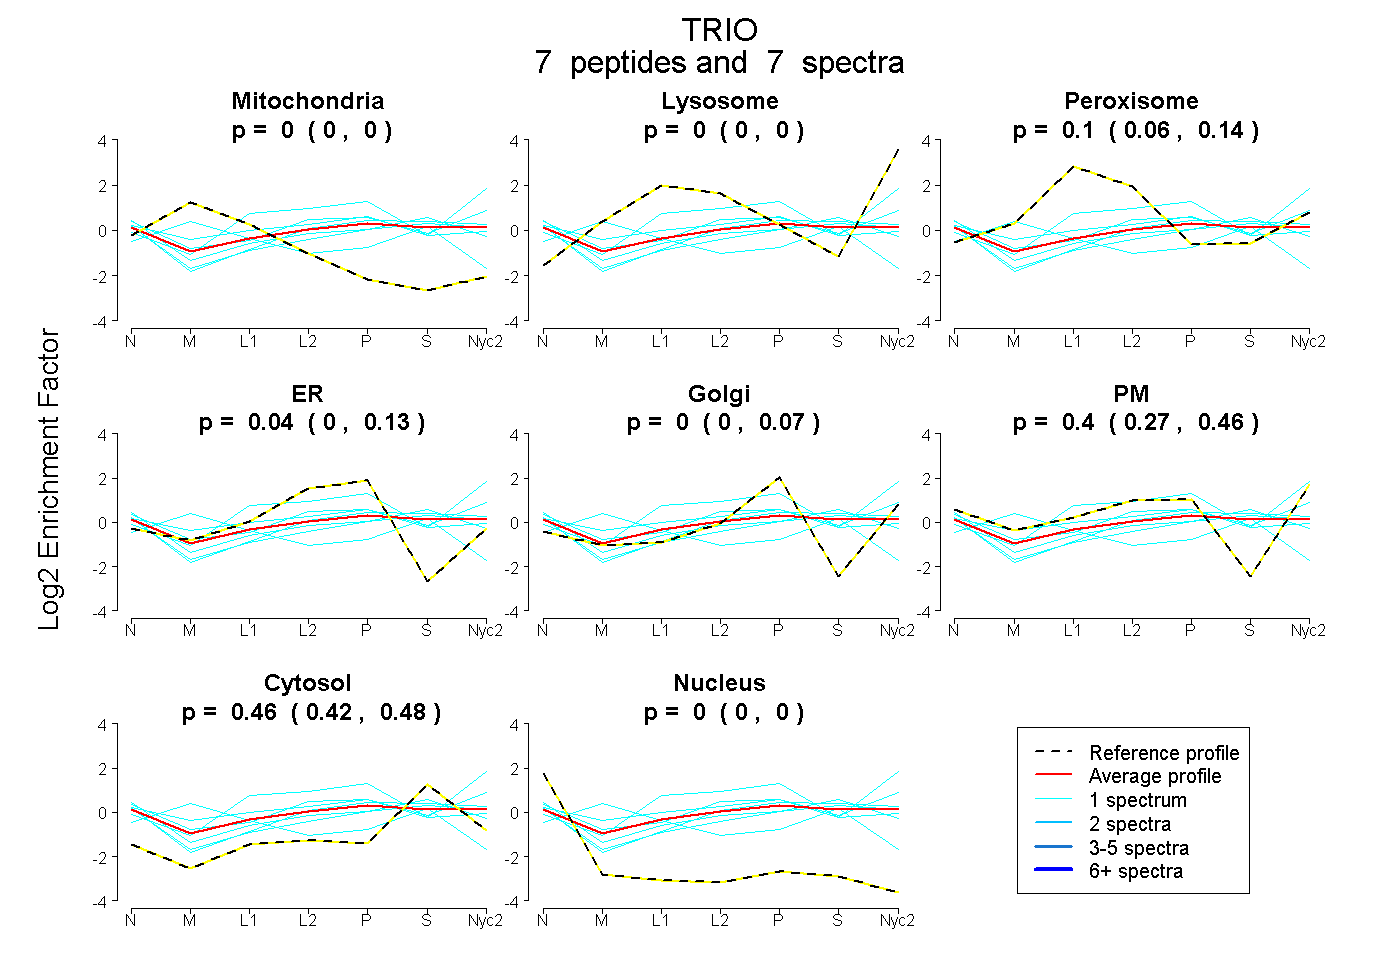
0.000 | 0.000
0.000 | 0.000
0.062 | 0.145
0.000 | 0.134
0.000 | 0.068
0.271 | 0.457
0.424 | 0.481
0.000 | 0.000
3peptides
spectra
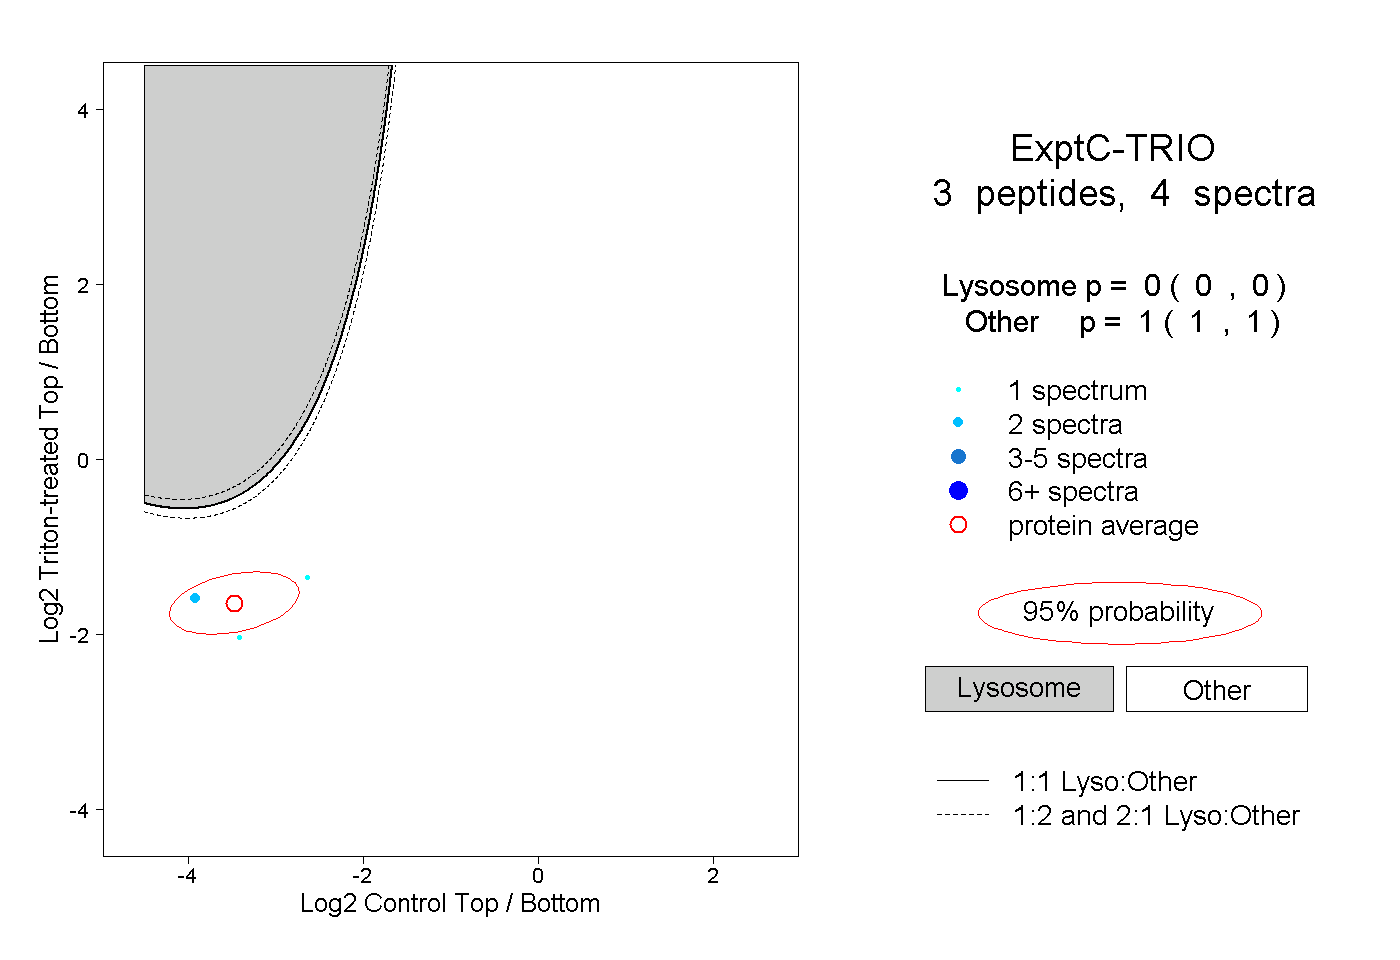
0.000 | 0.000
1.000 | 1.000
1peptide
spectrum

NA | NA
NA | NA