 7
7peptides
spectra
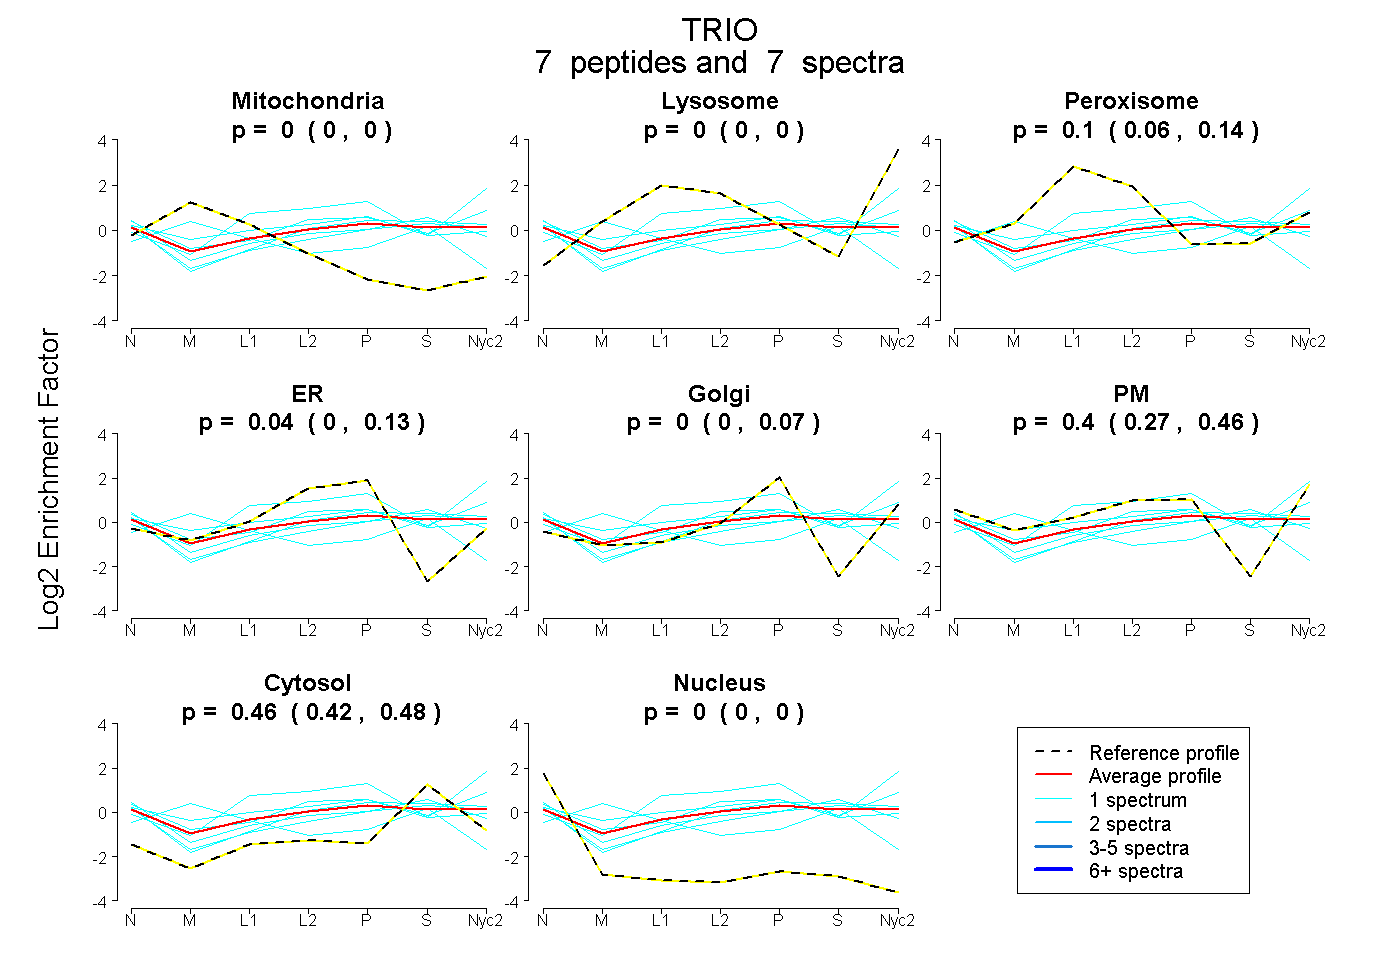
0.000 | 0.000
0.000 | 0.000
0.062 | 0.145
0.000 | 0.134
0.000 | 0.068
0.271 | 0.457
0.424 | 0.481
0.000 | 0.000
| Plot | Mito | Lyso | Perox | ER | Golgi | PM | Cytosol | Nucleus | |||||
| Expt A |
7 peptides |
7 spectra |
|
0.000 0.000 | 0.000 |
0.000 0.000 | 0.000 |
0.104 0.062 | 0.145 |
0.042 0.000 | 0.134 |
0.000 0.000 | 0.068 |
0.395 0.271 | 0.457 |
0.459 0.424 | 0.481 |
0.000 0.000 | 0.000 |
| 1 spectrum, AMDVLPILK | 0.000 | 0.300 | 0.094 | 0.000 | 0.150 | 0.282 | 0.174 | 0.000 | ||
| 1 spectrum, VAYLSGGR | 0.448 | 0.000 | 0.090 | 0.024 | 0.000 | 0.000 | 0.438 | 0.000 | ||
| 1 spectrum, DAAHELNEEK | 0.000 | 0.000 | 0.042 | 0.000 | 0.000 | 0.427 | 0.527 | 0.004 | ||
| 1 spectrum, APIEDLDLEGQK | 0.027 | 0.000 | 0.196 | 0.147 | 0.066 | 0.248 | 0.317 | 0.000 | ||
| 1 spectrum, LEELQDVLAK | 0.000 | 0.000 | 0.000 | 0.033 | 0.000 | 0.422 | 0.546 | 0.000 | ||
| 1 spectrum, QQELDLAAEQHR | 0.000 | 0.000 | 0.060 | 0.000 | 0.000 | 0.590 | 0.350 | 0.000 | ||
| 1 spectrum, EHEQFQHAIEK | 0.000 | 0.000 | 0.000 | 0.054 | 0.000 | 0.310 | 0.632 | 0.003 |
| Plot | Lyso | Other | |||||||||||
| Expt C |
3 peptides |
4 spectra |
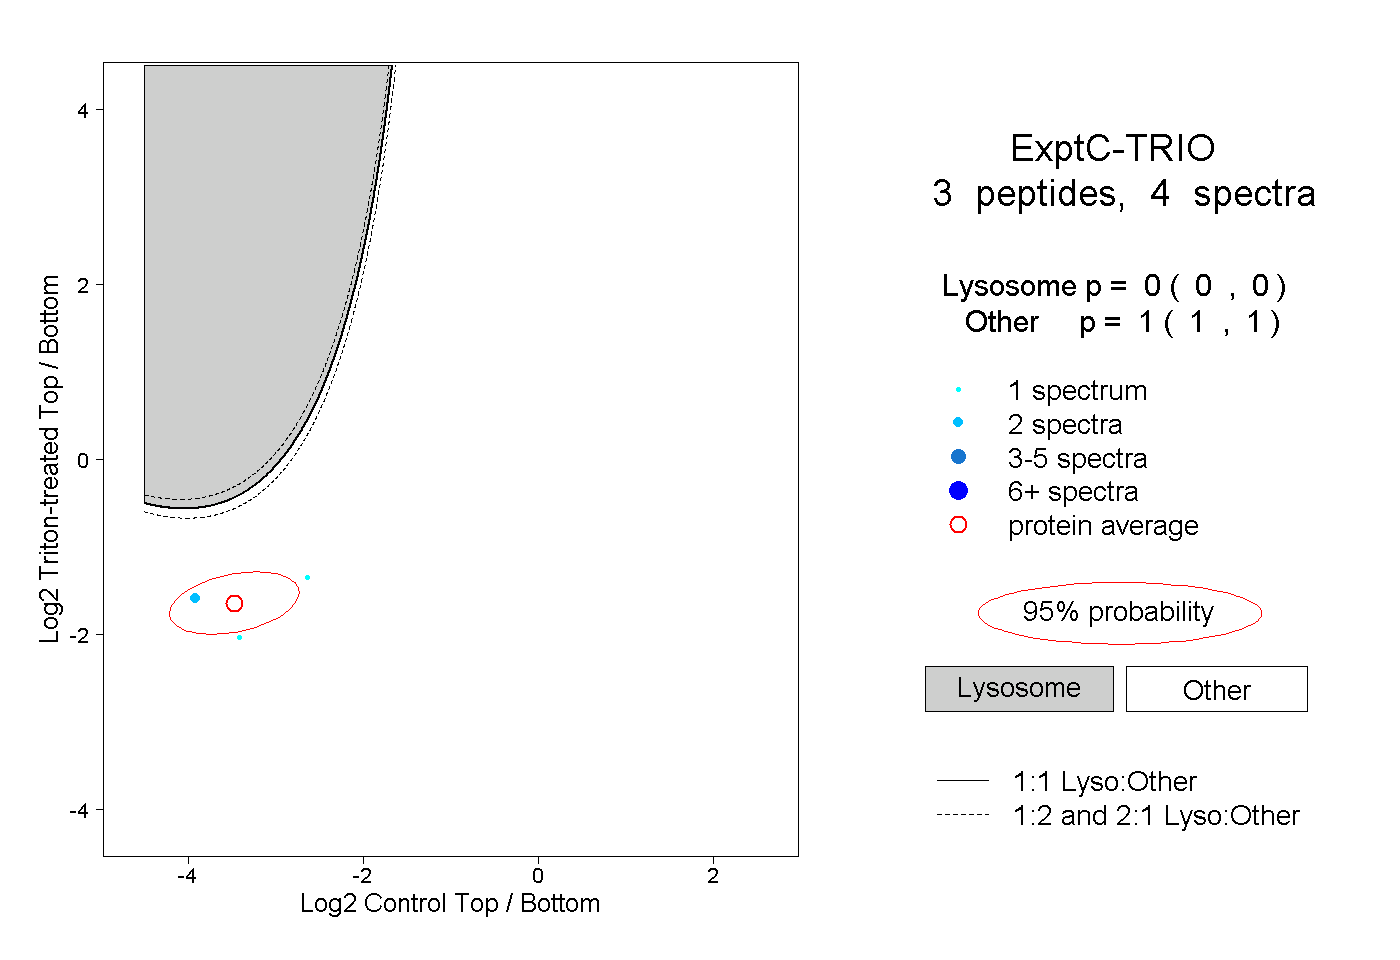 |
0.000 0.000 | 0.000 |
1.000 1.000 | 1.000 |
||||||||
| Plot | Lyso | Other | |||||||||||
| Expt D |
1 peptide |
1 spectrum |
 |
0.000 NA | NA |
1.000 NA | NA |