 6
6peptides
spectra
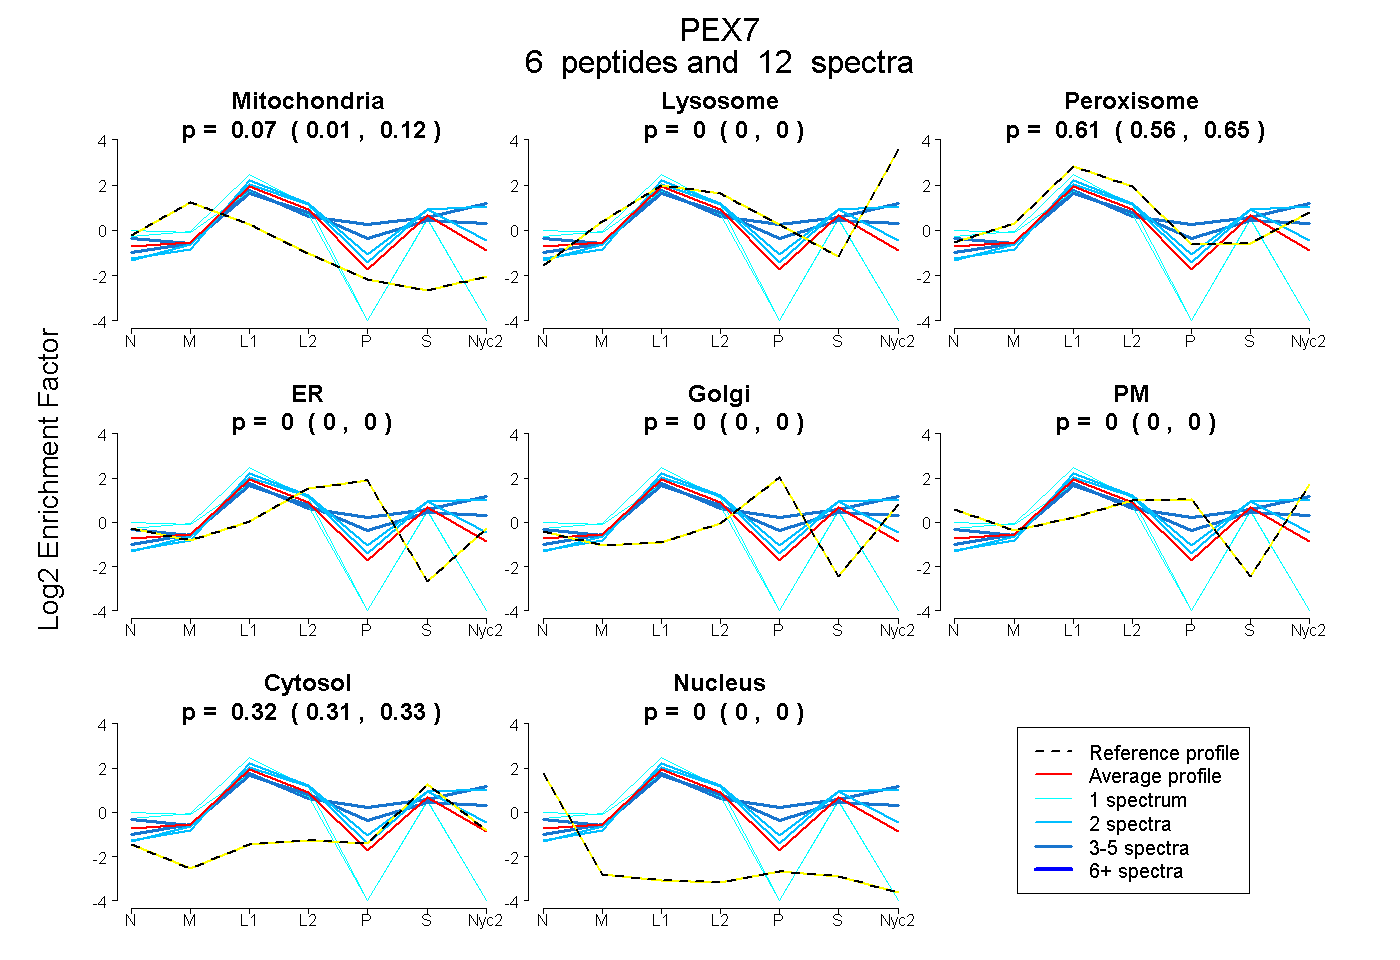
0.013 | 0.118
0.000 | 0.000
0.555 | 0.653
0.000 | 0.000
0.000 | 0.000
0.000 | 0.000
0.311 | 0.332
0.000 | 0.000
1peptide
spectrum
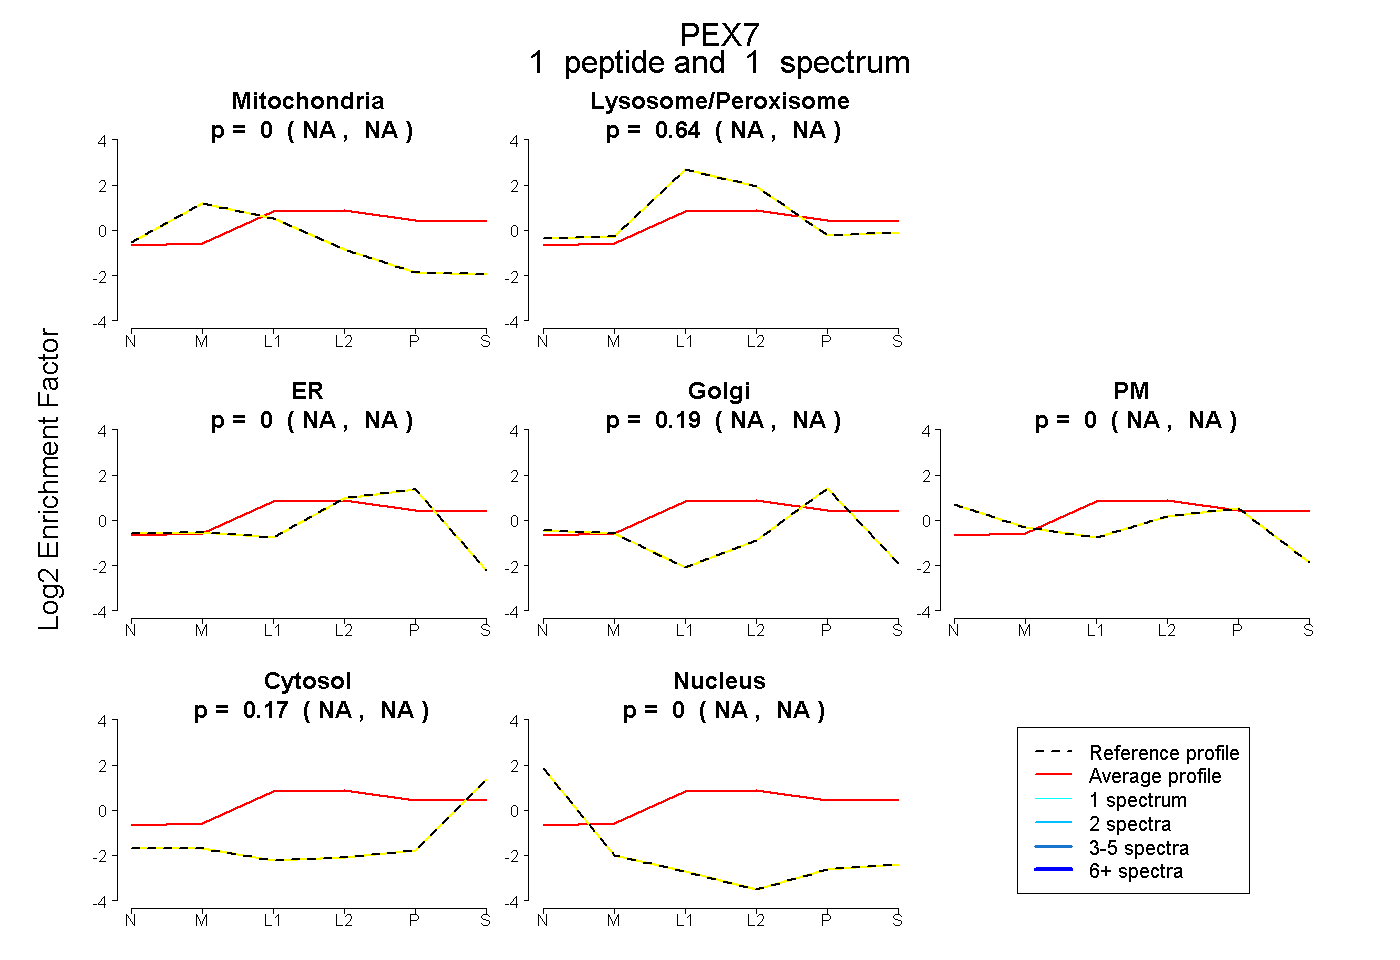
NA | NA
NA | NA
NA | NA
NA | NA
NA | NA
NA | NA
NA | NA
7peptides
spectra
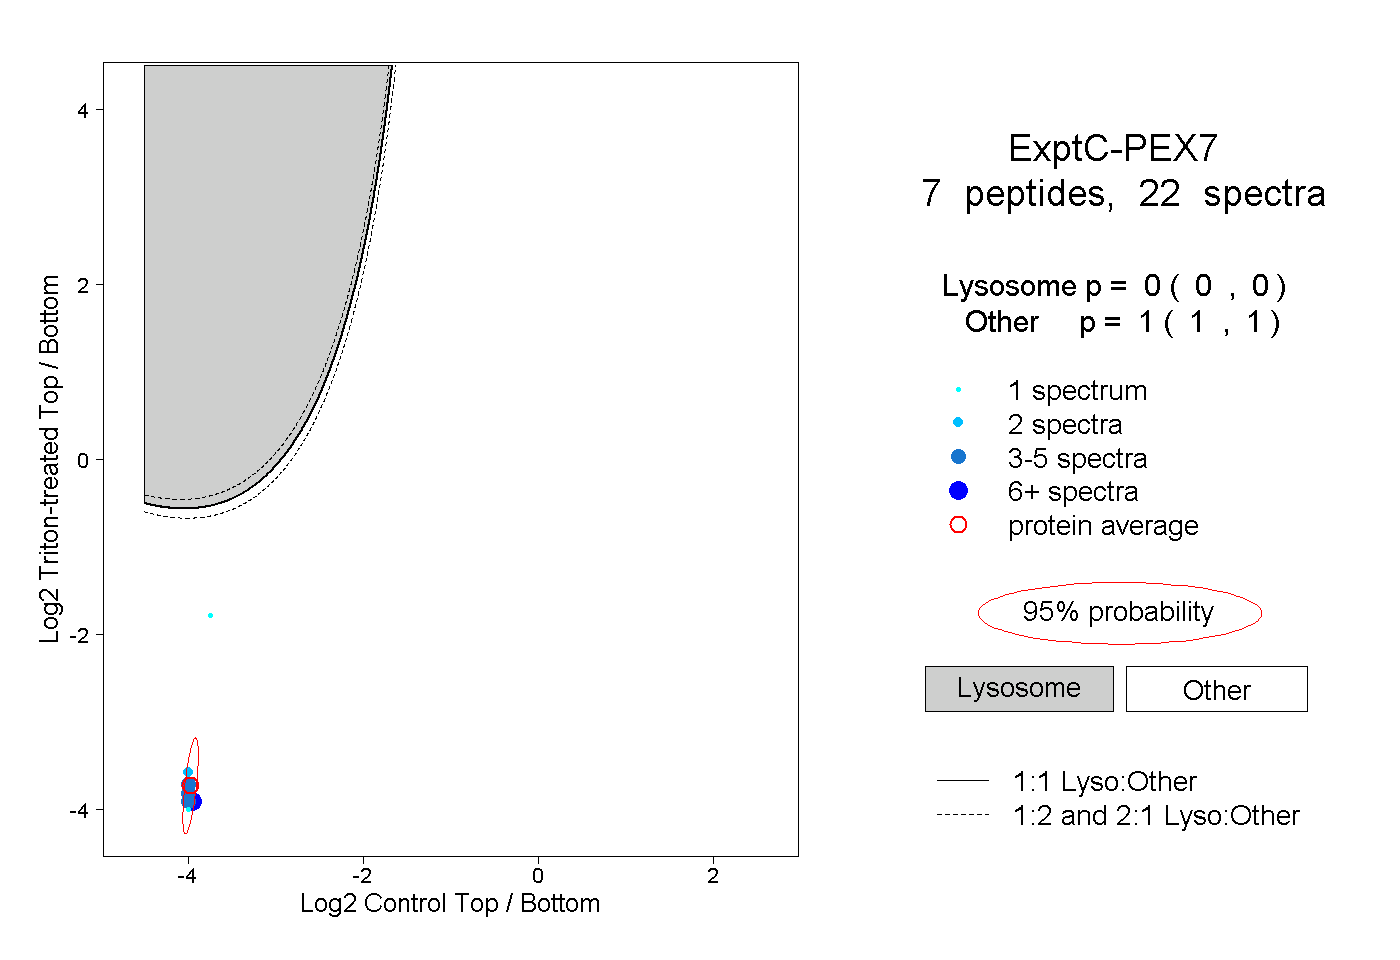
0.000 | 0.000
1.000 | 1.000