 6
6peptides
spectra
0.013 | 0.118
0.000 | 0.000
0.555 | 0.653
0.000 | 0.000
0.000 | 0.000
0.000 | 0.000
0.311 | 0.332
0.000 | 0.000
| Plot | Mito | Lyso | Perox | ER | Golgi | PM | Cytosol | Nucleus | |||||
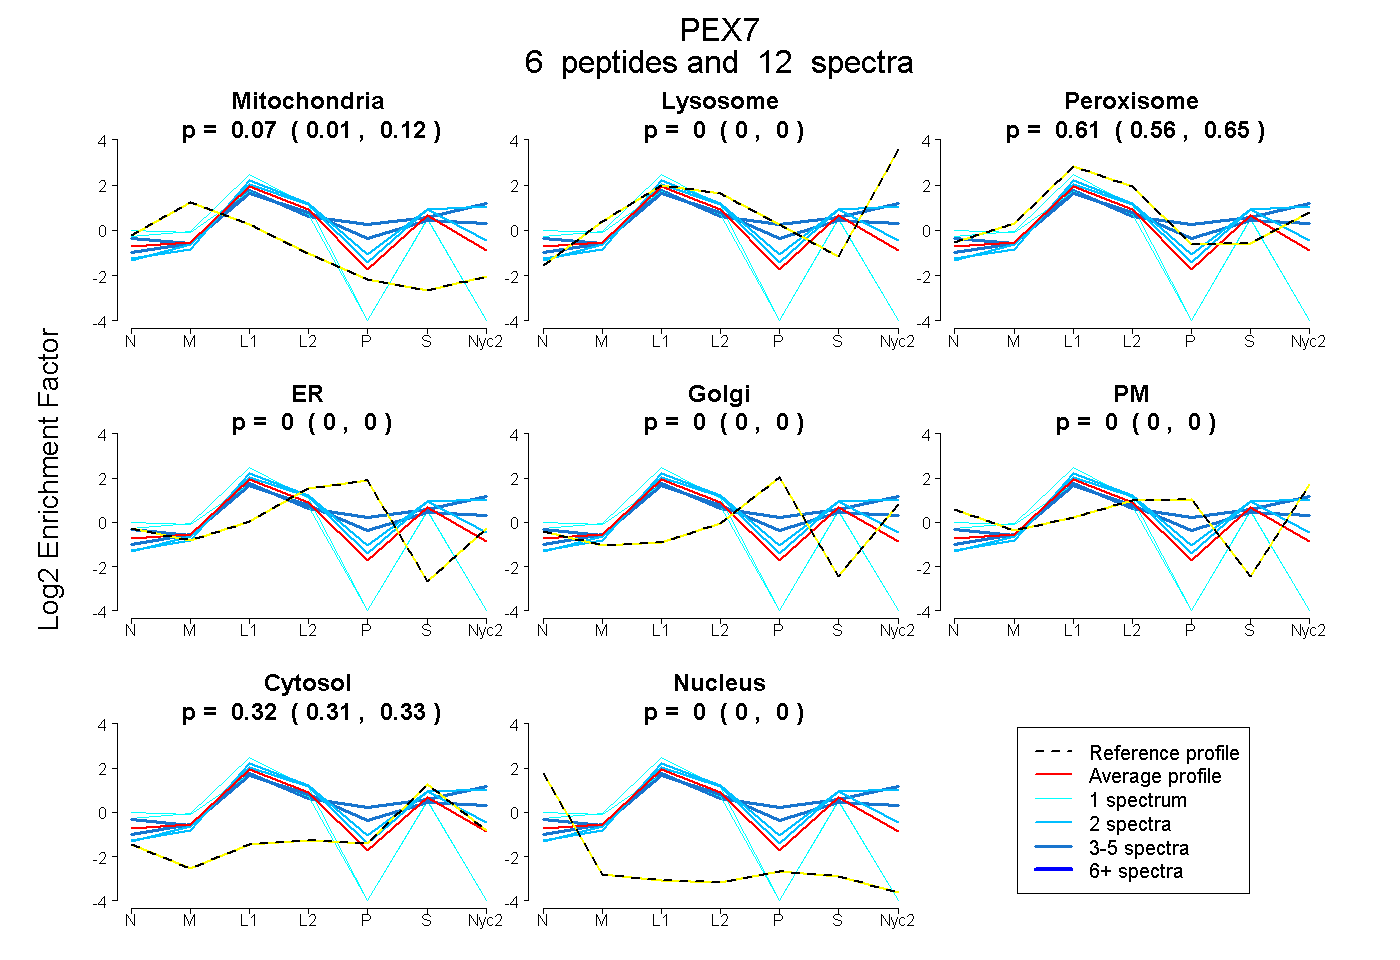
| Expt A |
6 peptides |
12 spectra |
|
0.069 0.013 | 0.118 |
0.000 0.000 | 0.000 |
0.608 0.555 | 0.653 |
0.000 0.000 | 0.000 |
0.000 0.000 | 0.000 |
0.000 0.000 | 0.000 |
0.323 0.311 | 0.332 |
0.000 0.000 | 0.000 |
| 2 spectra, YNENLLVTGAVDCSLR | 0.000 | 0.000 | 0.665 | 0.000 | 0.000 | 0.000 | 0.335 | 0.000 | ||
| 2 spectra, VWDPTVGNSLCTFR | 0.000 | 0.098 | 0.638 | 0.000 | 0.000 | 0.000 | 0.265 | 0.000 | ||
| 1 spectrum, DEQLVVSGSWDQTVK | 0.534 | 0.000 | 0.308 | 0.000 | 0.000 | 0.000 | 0.158 | 0.000 | ||
| 3 spectra, QPVFELLGHTYAIR | 0.000 | 0.000 | 0.681 | 0.000 | 0.005 | 0.012 | 0.301 | 0.000 | ||
| 3 spectra, HGYAVEFSPYLPGR | 0.000 | 0.296 | 0.418 | 0.000 | 0.000 | 0.000 | 0.287 | 0.000 | ||
| 1 spectrum, IVIPAHQAEILSCDWCK | 0.593 | 0.000 | 0.176 | 0.000 | 0.000 | 0.000 | 0.230 | 0.000 |
| Plot | Mito | Lyso or Perox | ER | Golgi | PM | Cytosol | Nucleus | ||||||
| Expt B |
1 peptide |
1 spectrum |
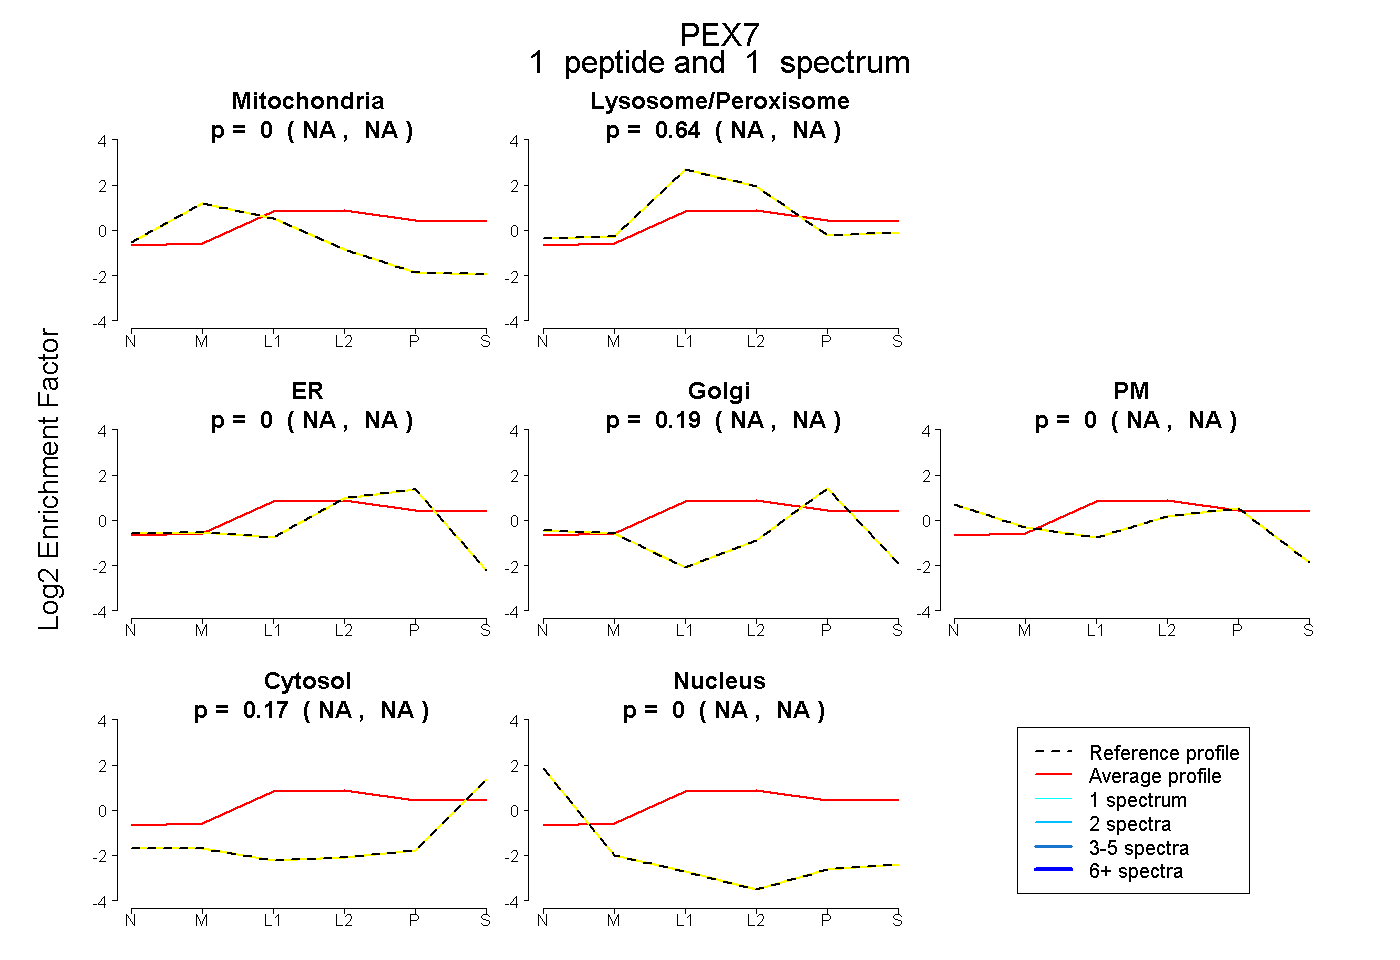 |
0.000 NA | NA |
0.635 NA | NA |
0.000 NA | NA |
0.194 NA | NA |
0.000 NA | NA |
0.171 NA | NA |
0.000 NA | NA |
|||
| Plot | Lyso | Other | |||||||||||
| Expt C |
7 peptides |
22 spectra |
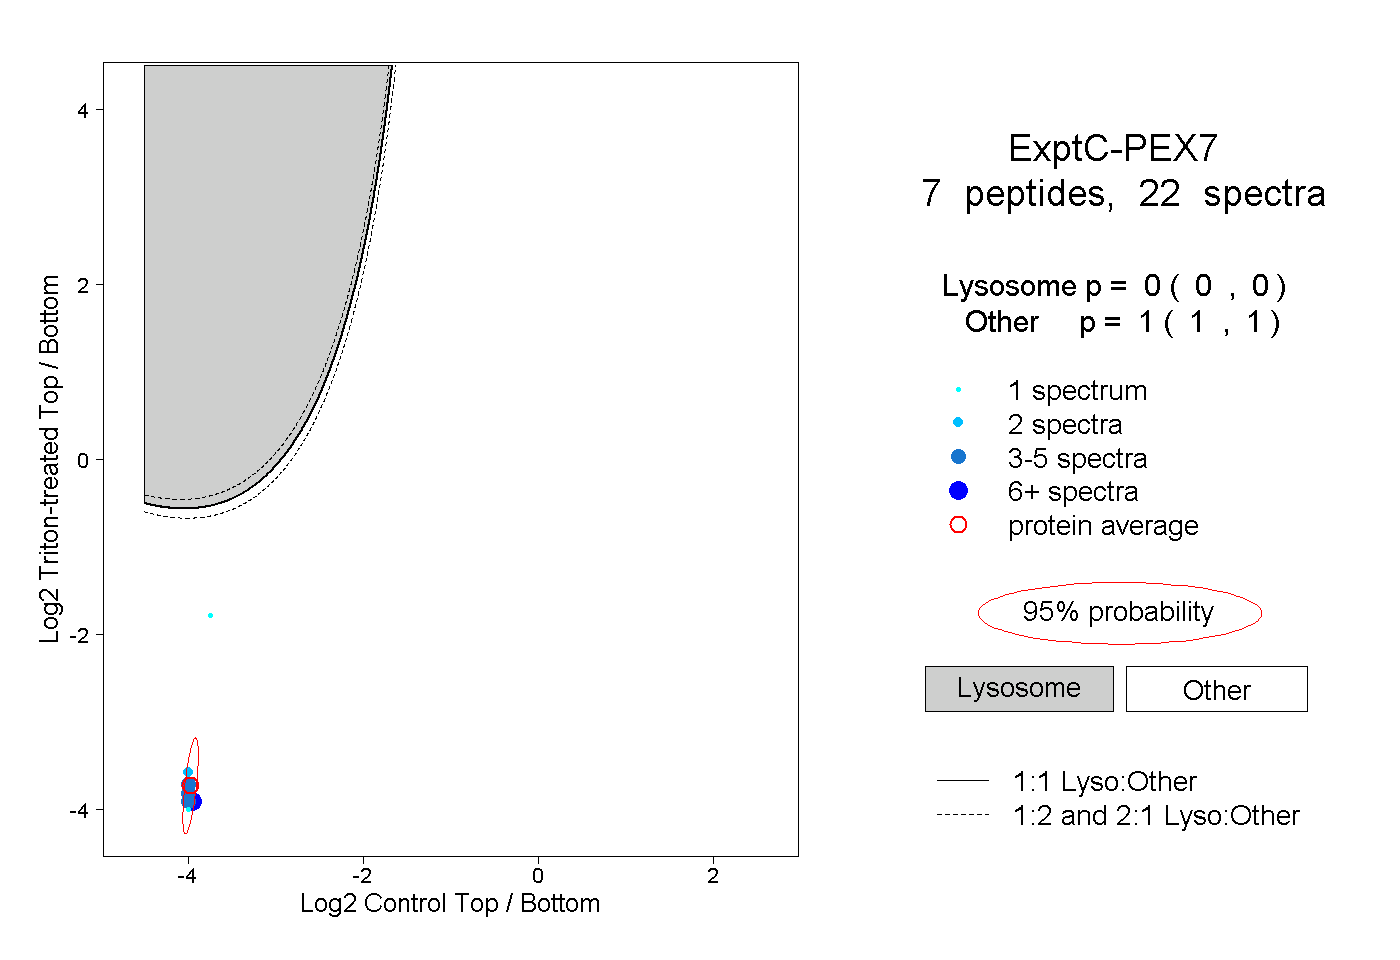 |
0.000 0.000 | 0.000 |
1.000 1.000 | 1.000 |