 6
6peptides
spectra
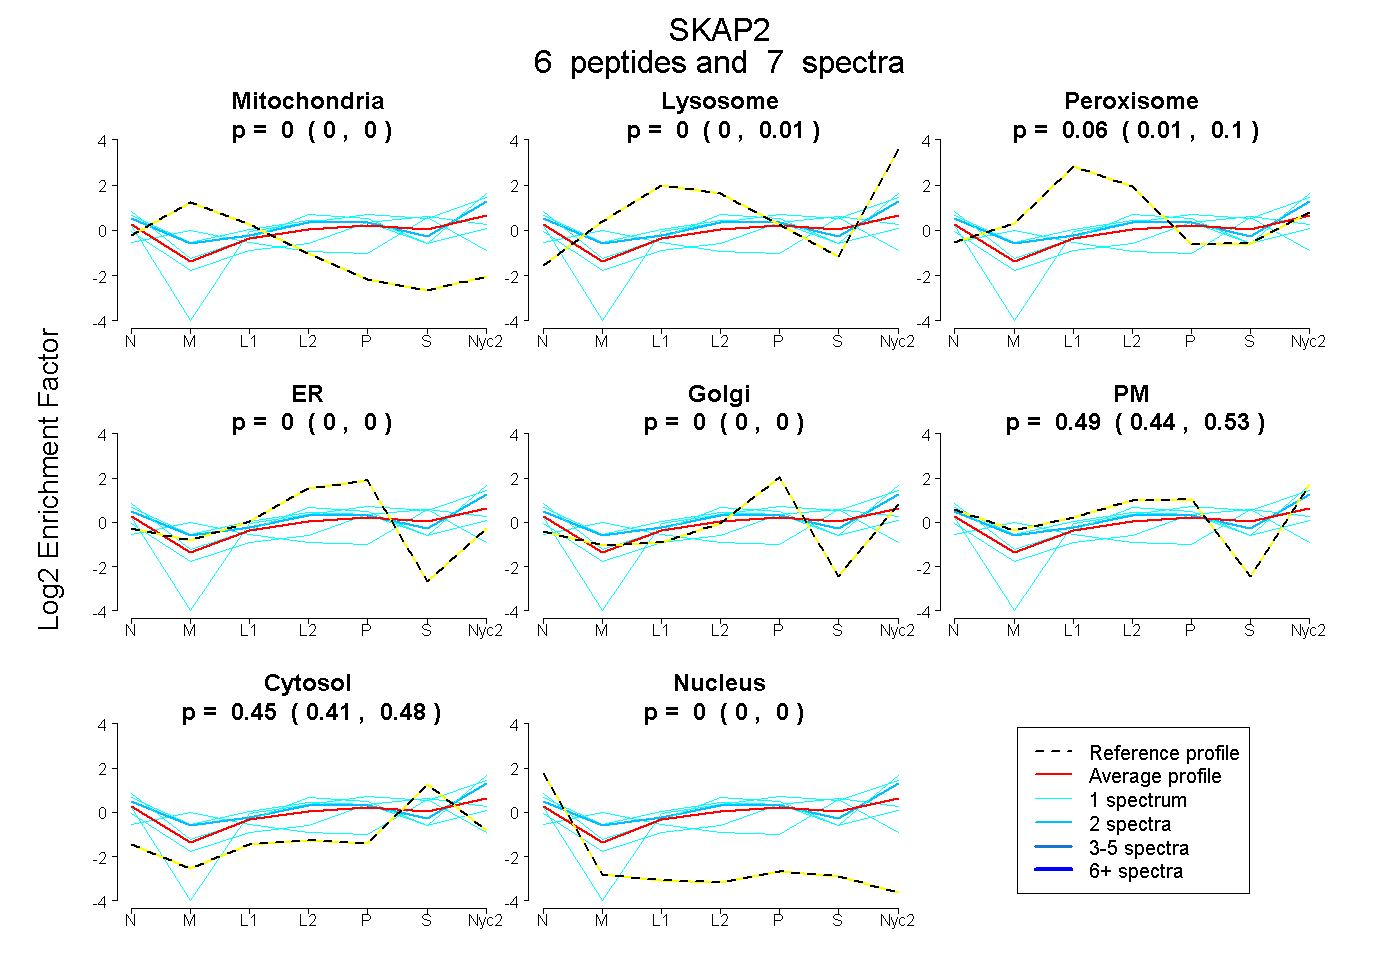
0.000 | 0.000
0.000 | 0.014
0.006 | 0.096
0.000 | 0.000
0.000 | 0.000
0.440 | 0.527
0.415 | 0.485
0.000 | 0.000
2peptides
spectra
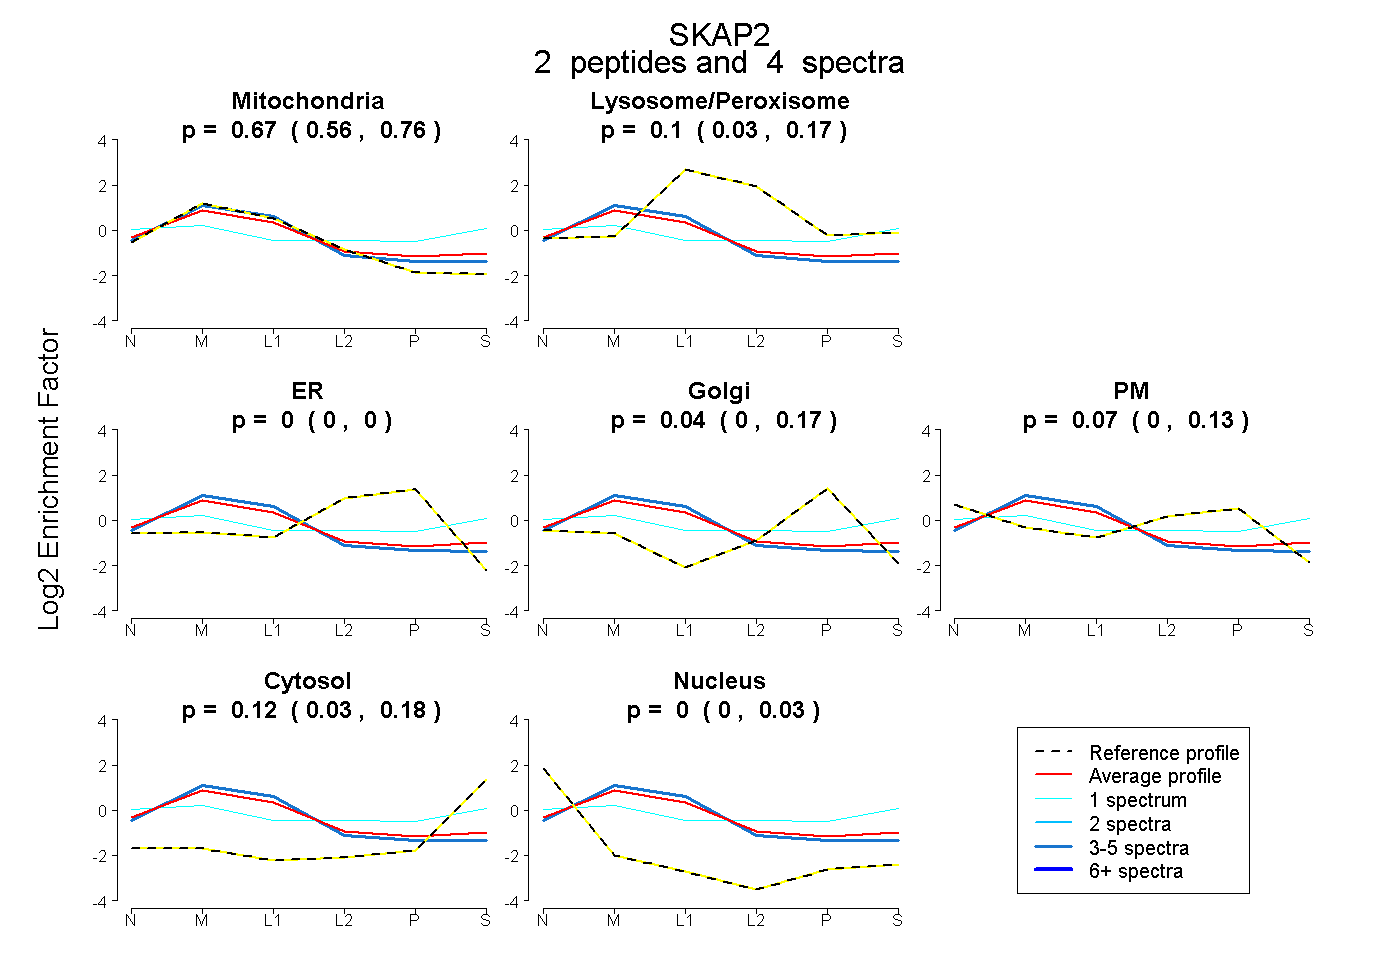
0.563 | 0.762
0.035 | 0.172
0.000 | 0.000
0.000 | 0.165
0.000 | 0.125
0.025 | 0.179
0.000 | 0.025
6peptides
spectra
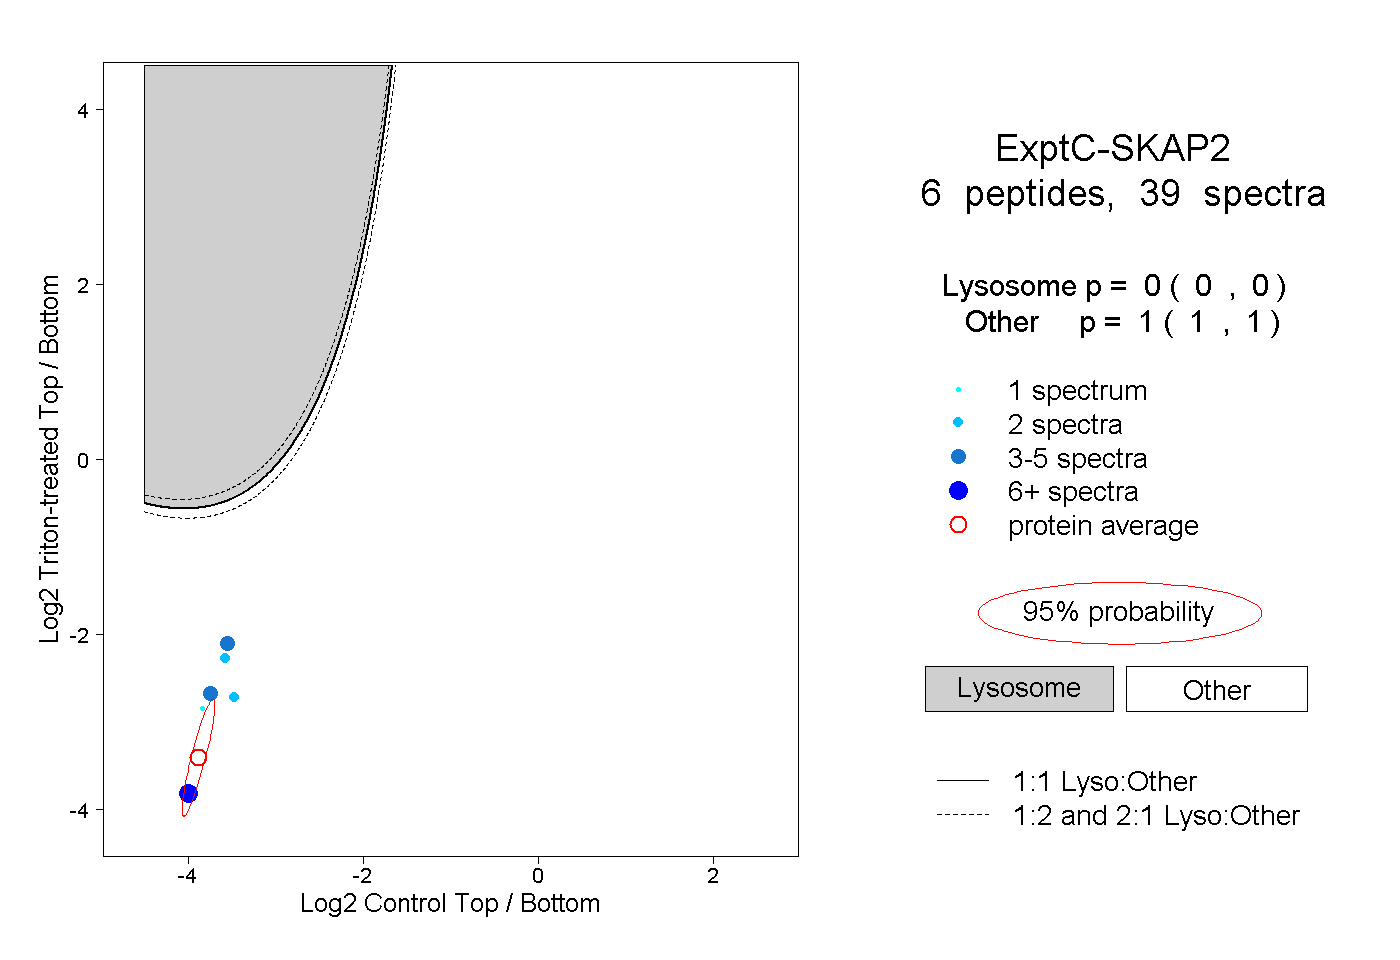
0.000 | 0.000
1.000 | 1.000