 6
6peptides
spectra
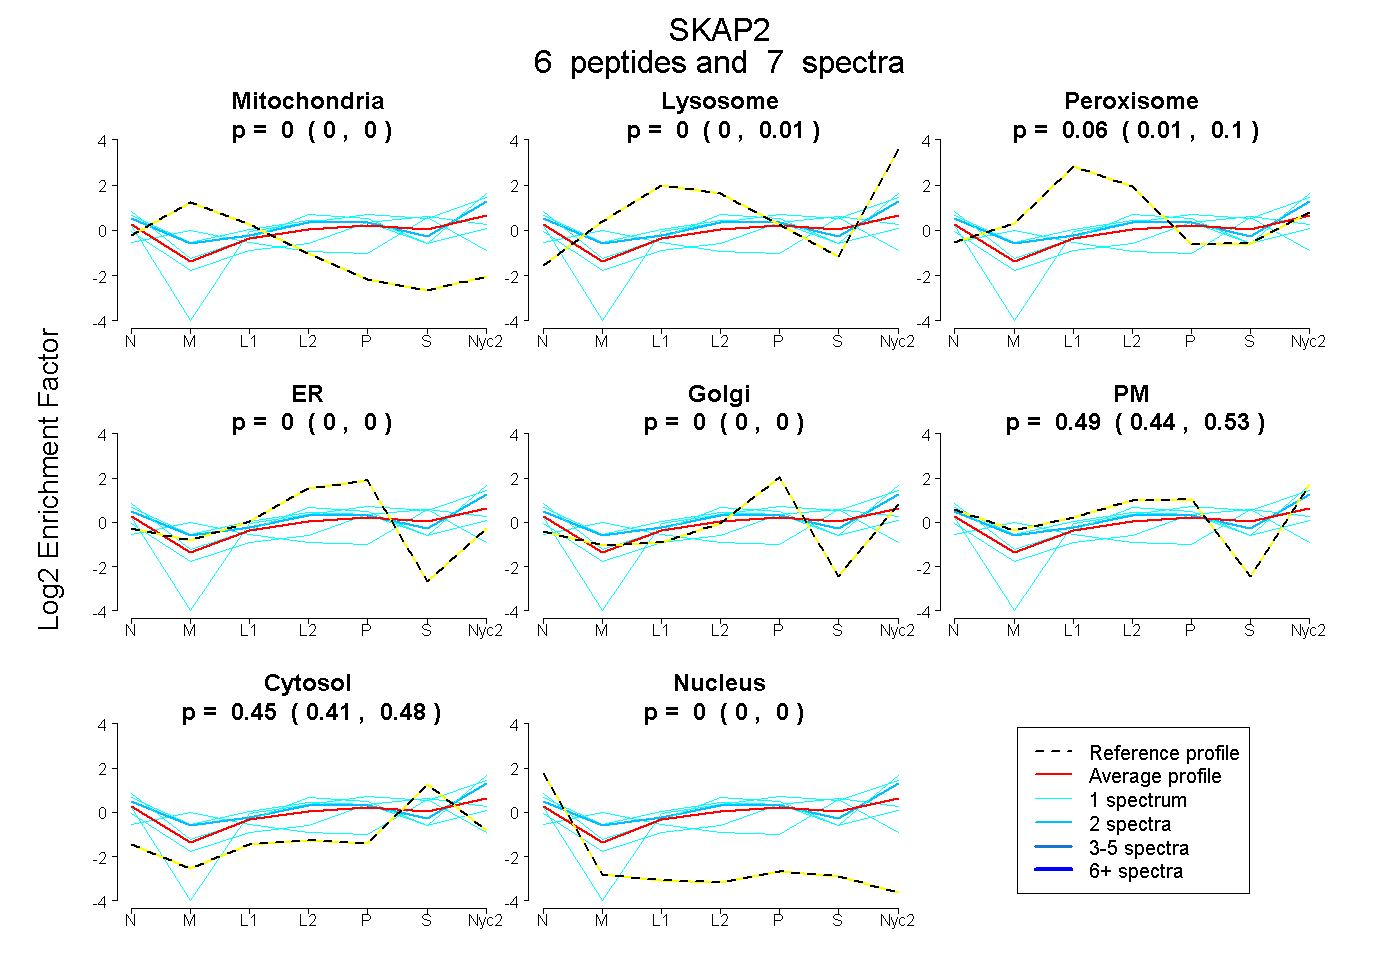
0.000 | 0.000
0.000 | 0.014
0.006 | 0.096
0.000 | 0.000
0.000 | 0.000
0.440 | 0.527
0.415 | 0.485
0.000 | 0.000
| Plot | Mito | Lyso | Perox | ER | Golgi | PM | Cytosol | Nucleus | |||||
| Expt A |
6 peptides |
7 spectra |
|
0.000 0.000 | 0.000 |
0.000 0.000 | 0.014 |
0.057 0.006 | 0.096 |
0.000 0.000 | 0.000 |
0.000 0.000 | 0.000 |
0.490 0.440 | 0.527 |
0.453 0.415 | 0.485 |
0.000 0.000 | 0.000 |
| 1 spectrum, AGYLEK | 0.299 | 0.009 | 0.148 | 0.000 | 0.008 | 0.000 | 0.536 | 0.000 | ||
| 1 spectrum, GDVIYILSK | 0.000 | 0.000 | 0.212 | 0.080 | 0.000 | 0.408 | 0.227 | 0.072 | ||
| 2 spectra, MDEQGK | 0.000 | 0.055 | 0.058 | 0.000 | 0.000 | 0.575 | 0.311 | 0.000 | ||
| 1 spectrum, IYQFTAASPK | 0.000 | 0.040 | 0.000 | 0.000 | 0.000 | 0.423 | 0.537 | 0.000 | ||
| 1 spectrum, PNPGSTSSPGSIPEEIR | 0.000 | 0.018 | 0.000 | 0.000 | 0.000 | 0.717 | 0.266 | 0.000 | ||
| 1 spectrum, GEFAIEGYDVR | 0.000 | 0.000 | 0.000 | 0.000 | 0.101 | 0.301 | 0.599 | 0.000 |
| Plot | Mito | Lyso or Perox | ER | Golgi | PM | Cytosol | Nucleus | ||||||
| Expt B |
2 peptides |
4 spectra |
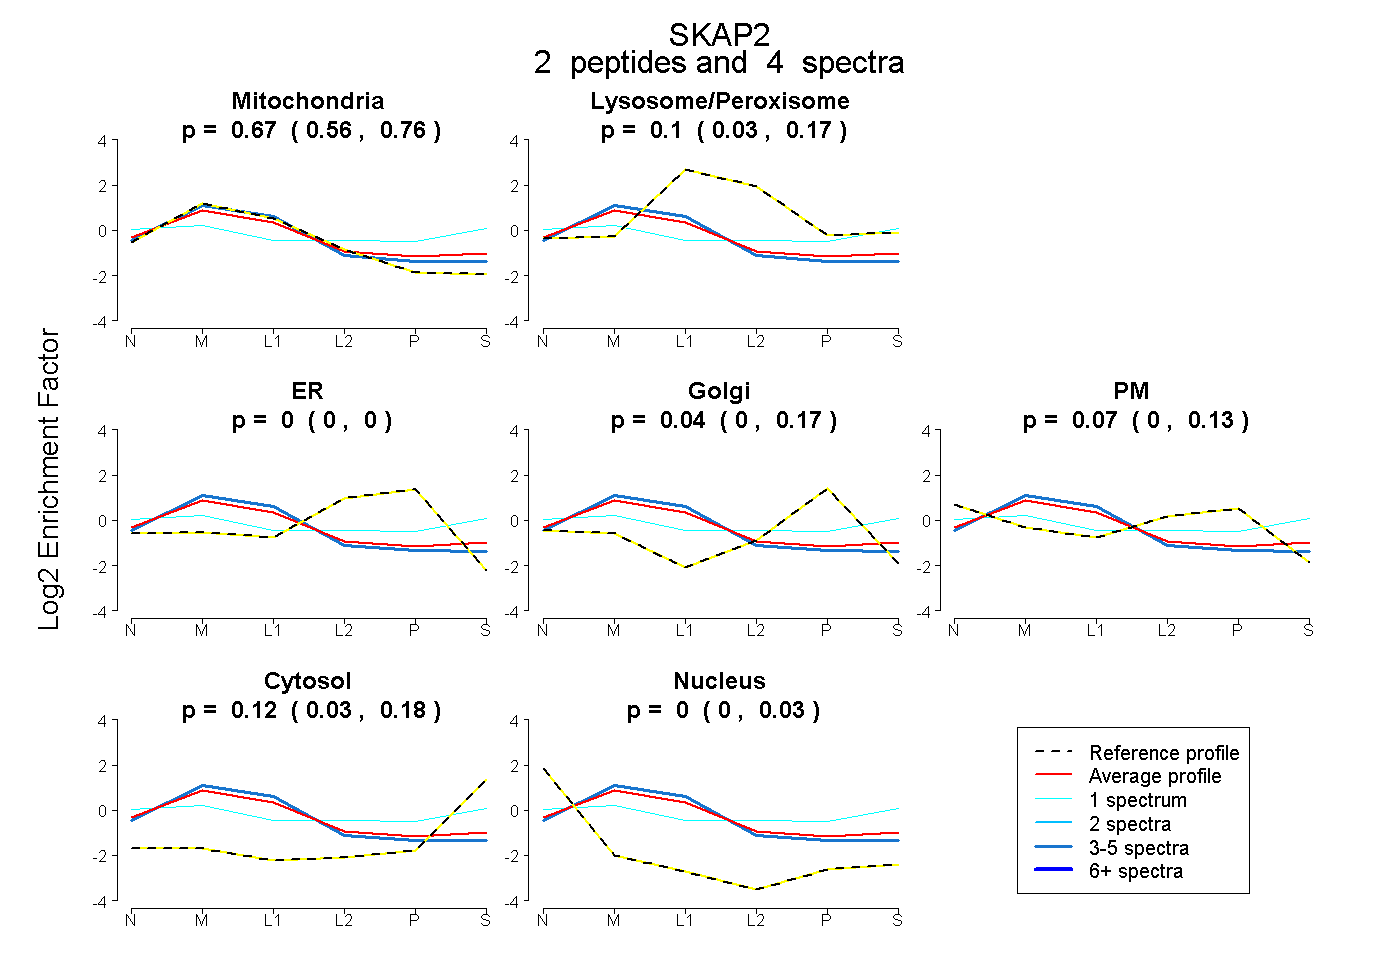 |
0.671 0.563 | 0.762 |
0.103 0.035 | 0.172 |
0.000 0.000 | 0.000 |
0.041 0.000 | 0.165 |
0.065 0.000 | 0.125 |
0.120 0.025 | 0.179 |
0.000 0.000 | 0.025 |
|||
| Plot | Lyso | Other | |||||||||||
| Expt C |
6 peptides |
39 spectra |
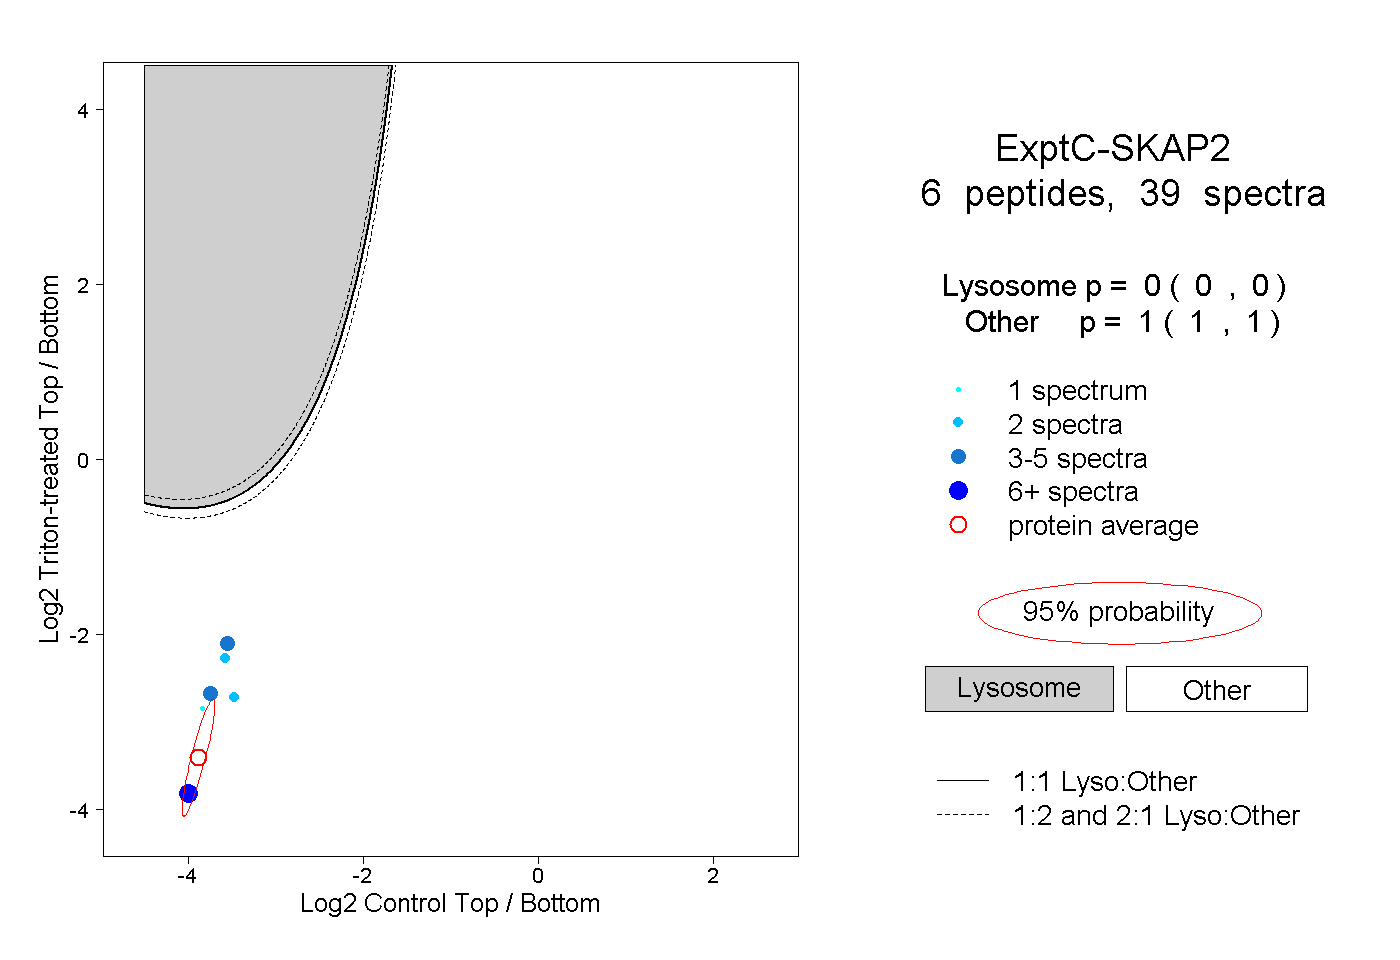 |
0.000 0.000 | 0.000 |
1.000 1.000 | 1.000 |