 5
5peptides
spectra
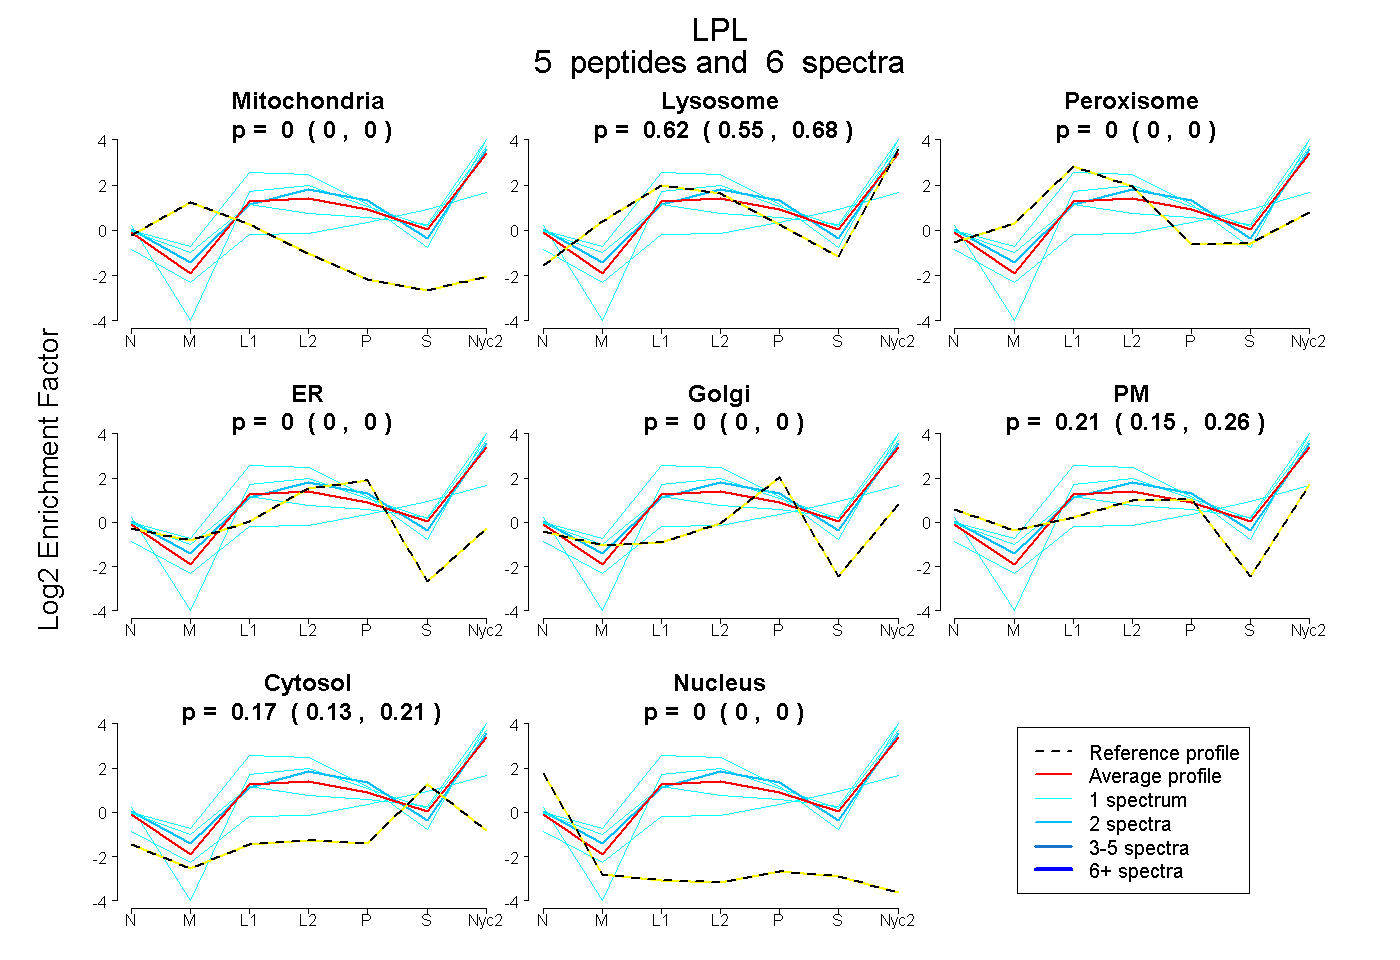
0.000 | 0.000
0.546 | 0.681
0.000 | 0.000
0.000 | 0.000
0.000 | 0.000
0.147 | 0.265
0.127 | 0.205
0.000 | 0.000
10peptides
spectra
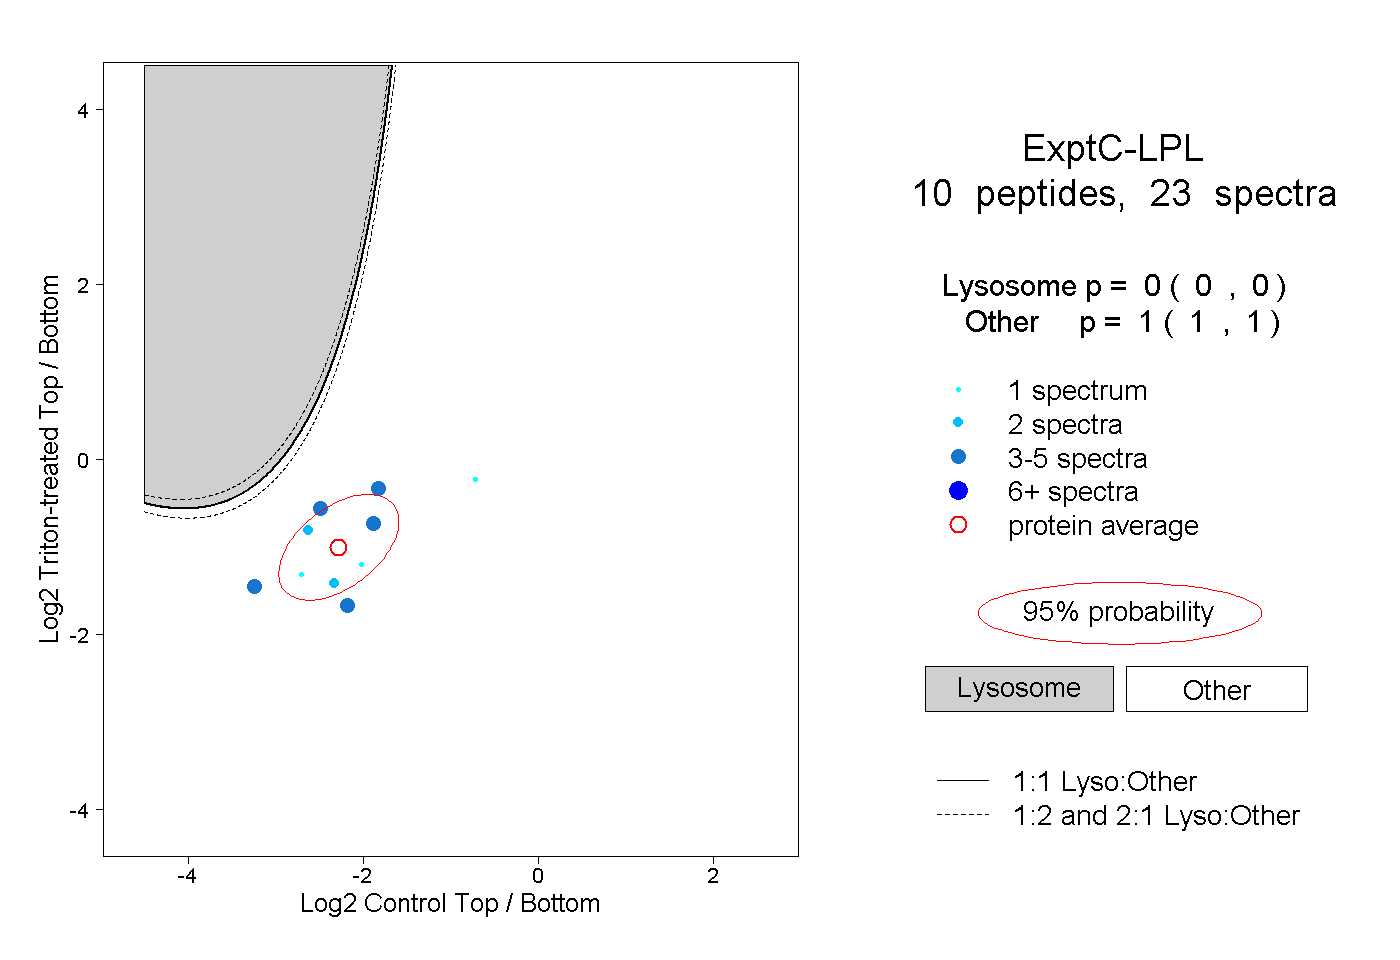
0.000 | 0.000
1.000 | 1.000
2peptides
spectra
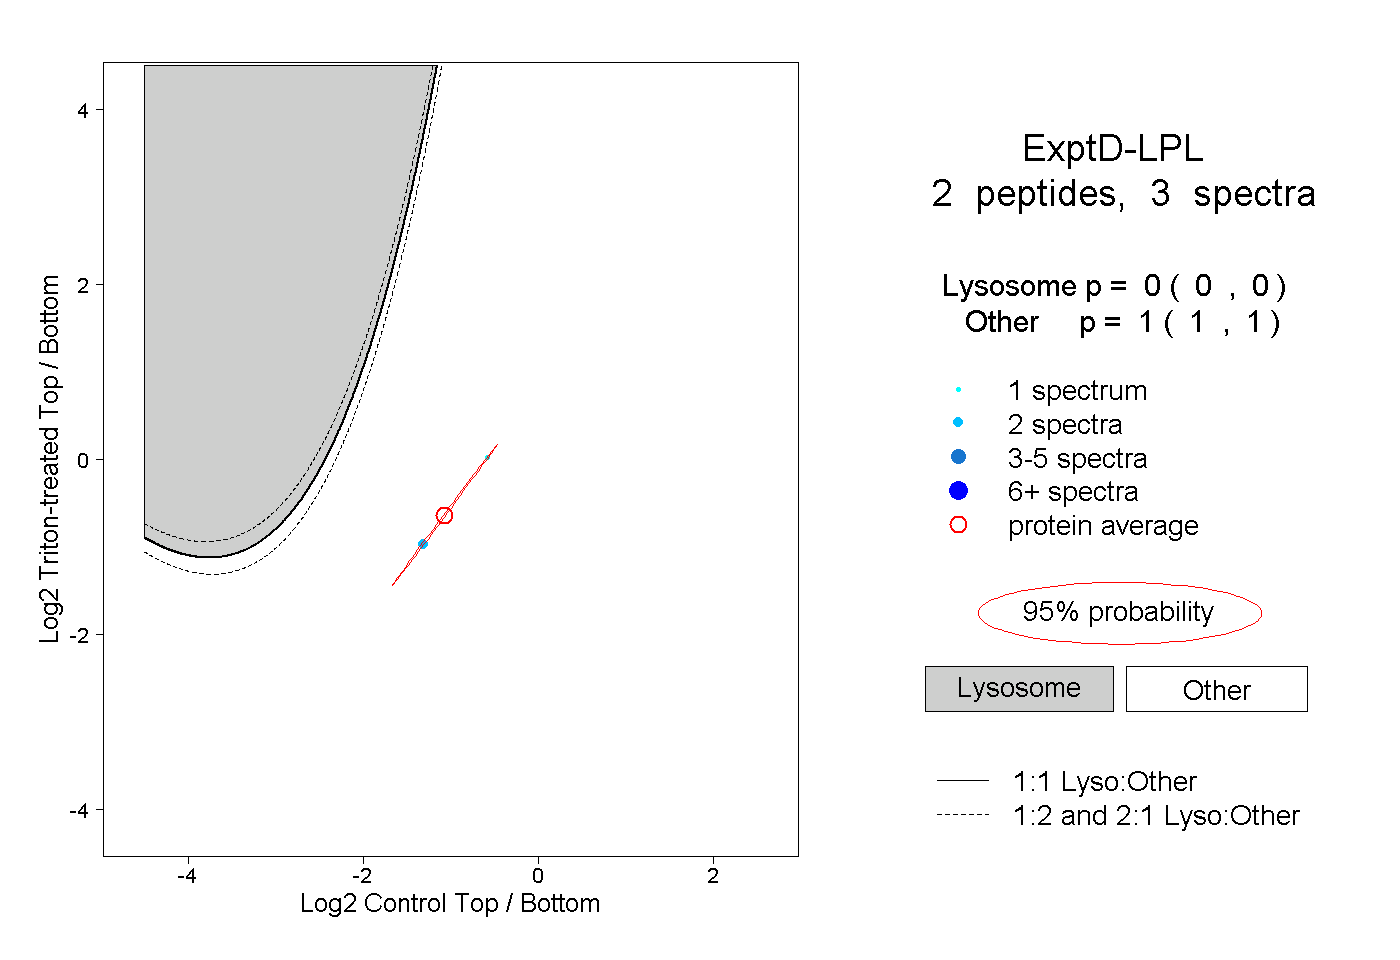
0.000 | 0.000
1.000 | 1.000