 5
5peptides
spectra
0.000 | 0.000
0.546 | 0.681
0.000 | 0.000
0.000 | 0.000
0.000 | 0.000
0.147 | 0.265
0.127 | 0.205
0.000 | 0.000
10peptides
spectra
0.000 | 0.000
1.000 | 1.000
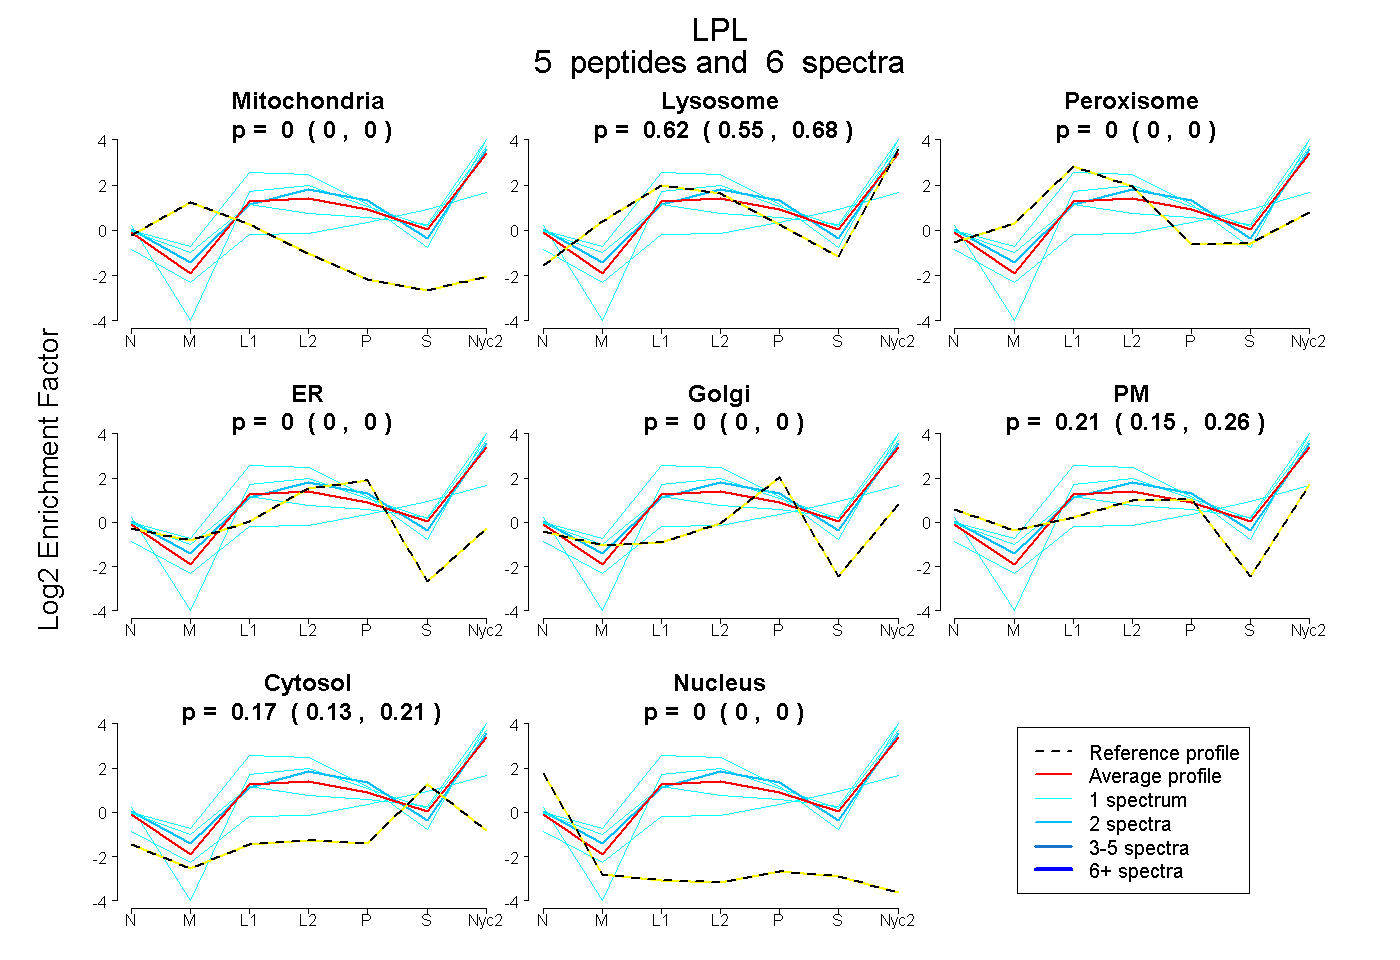
| Plot | Mito | Lyso | Perox | ER | Golgi | PM | Cytosol | Nucleus | |||||
| Expt A |
5 peptides |
6 spectra |
|
0.000 0.000 | 0.000 |
0.620 0.546 | 0.681 |
0.000 0.000 | 0.000 |
0.000 0.000 | 0.000 |
0.000 0.000 | 0.000 |
0.211 0.147 | 0.265 |
0.168 0.127 | 0.205 |
0.000 0.000 | 0.000 |
||
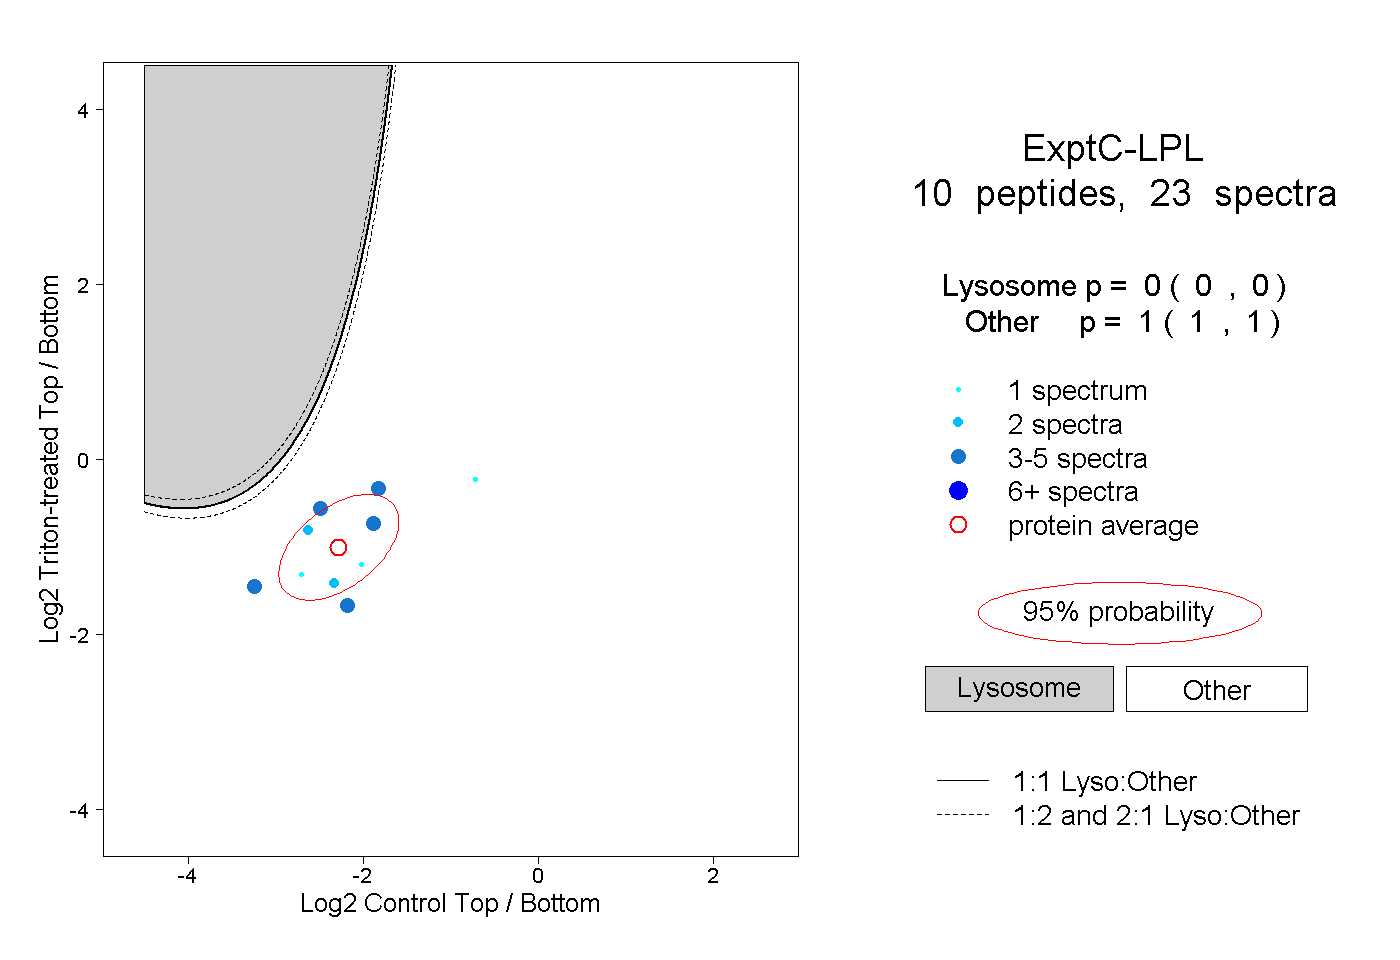
| Plot | Lyso | Other | |||||||||||
| Expt C |
10 peptides |
23 spectra |
|
0.000 0.000 | 0.000 |
1.000 1.000 | 1.000 |
| 1 spectrum, AGETQK | 0.000 | 1.000 | ||||||||
| 3 spectra, LVGNDVAR | 0.000 | 1.000 | ||||||||
| 3 spectra, VSHLQK | 0.000 | 1.000 | ||||||||
| 3 spectra, LVAALYK | 0.000 | 1.000 | ||||||||
| 1 spectrum, DFSDIESK | 0.000 | 1.000 | ||||||||
| 2 spectra, VLFCAR | 0.000 | 1.000 | ||||||||
| 1 spectrum, AQQHYPVSAGYTK | 0.000 | 1.000 | ||||||||
| 2 spectra, VFHYQVK | 0.000 | 1.000 | ||||||||
| 3 spectra, DAAVFVK | 0.000 | 1.000 | ||||||||
| 4 spectra, LSPDDADFVDVLHTFTR | 0.000 | 1.000 |
| Plot | Lyso | Other | |||||||||||
| Expt D |
2 peptides |
3 spectra |
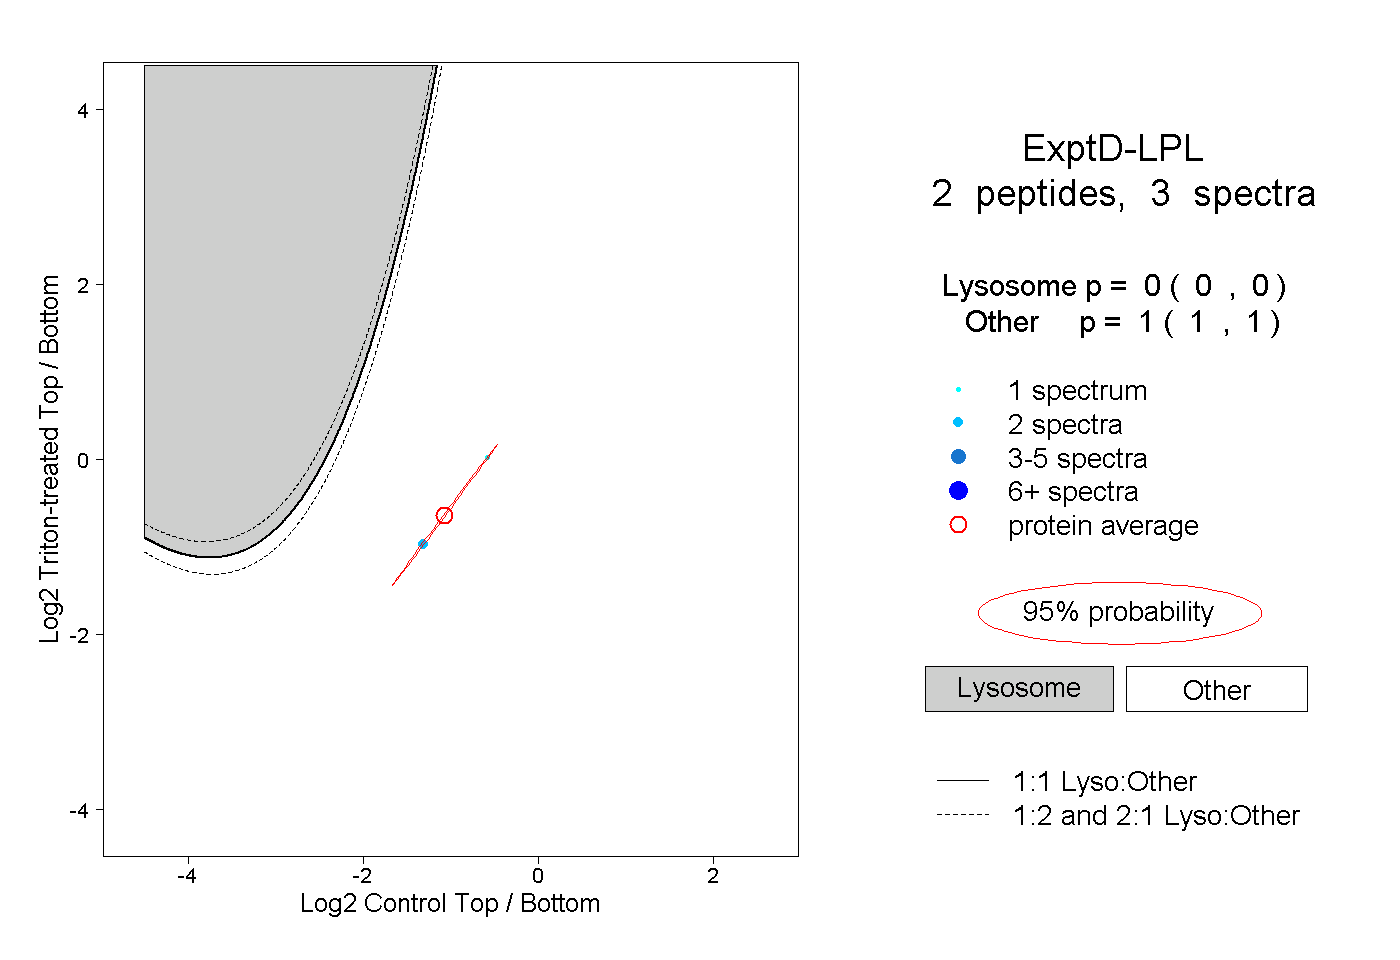 |
0.000 0.000 | 0.000 |
1.000 1.000 | 1.000 |