 5
5peptides
spectra

0.753 | 0.819
0.000 | 0.000
0.021 | 0.075
0.000 | 0.125
0.000 | 0.000
0.000 | 0.182
0.000 | 0.000
0.000 | 0.000
5peptides
spectra
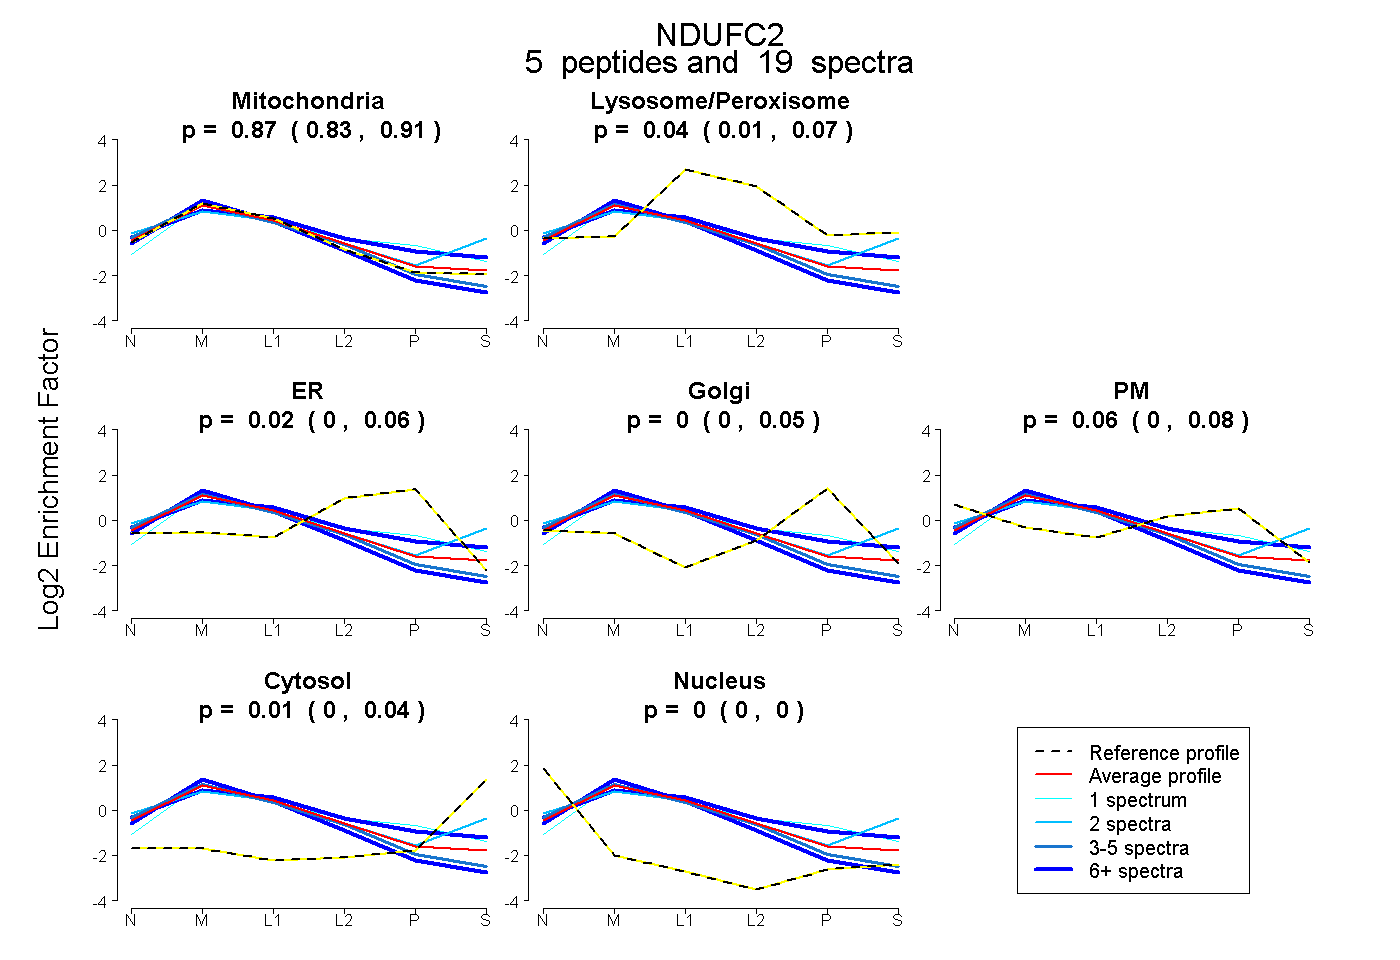
0.830 | 0.906
0.007 | 0.073
0.000 | 0.064
0.000 | 0.047
0.000 | 0.079
0.000 | 0.036
0.000 | 0.000
6peptides
spectra
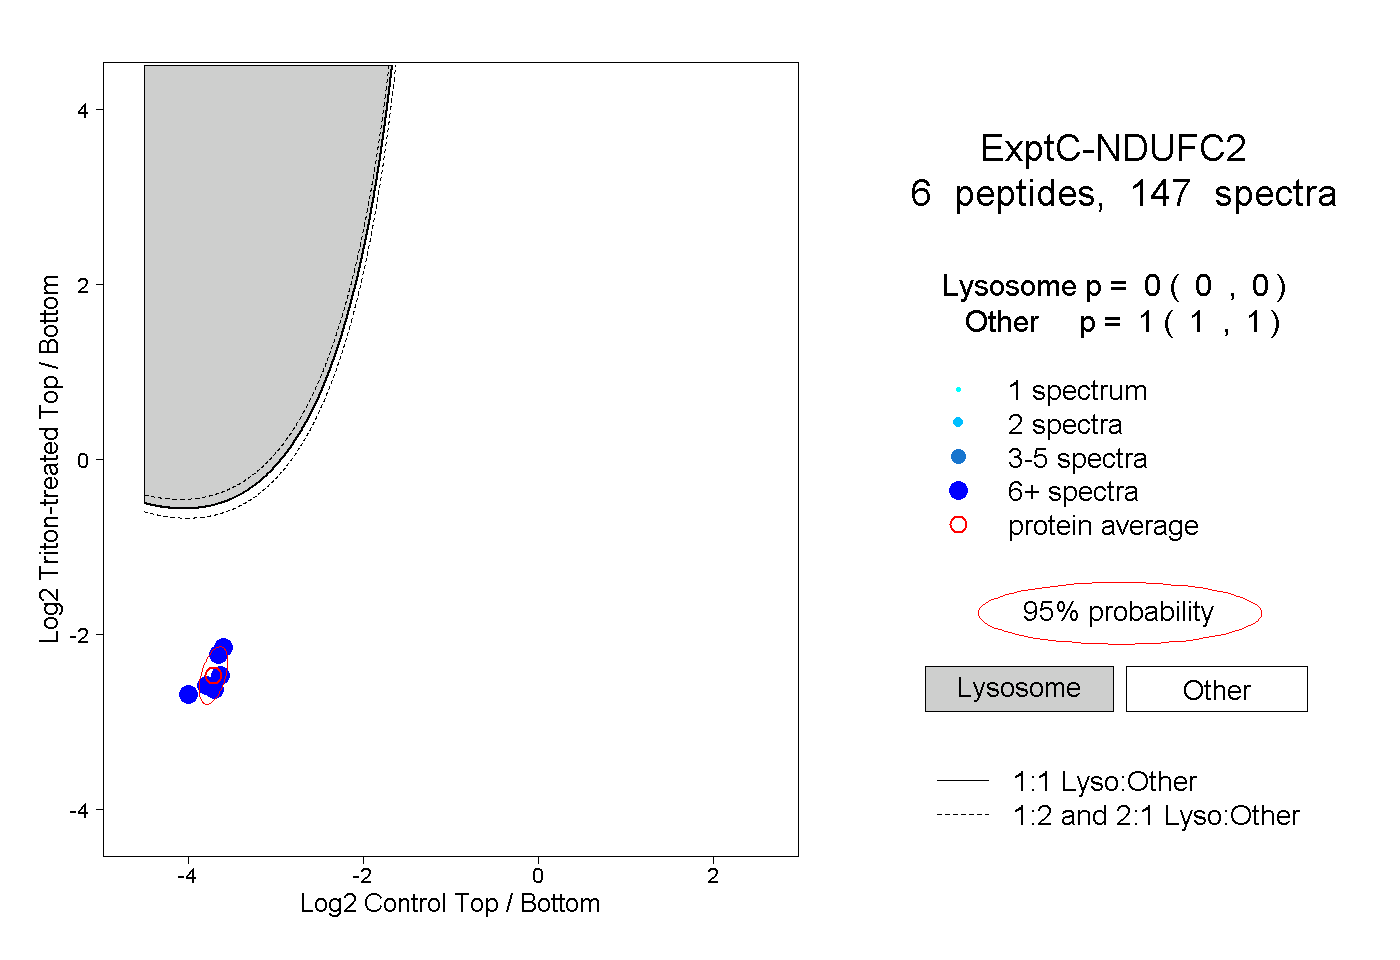
0.000 | 0.000
1.000 | 1.000
3peptides
spectra
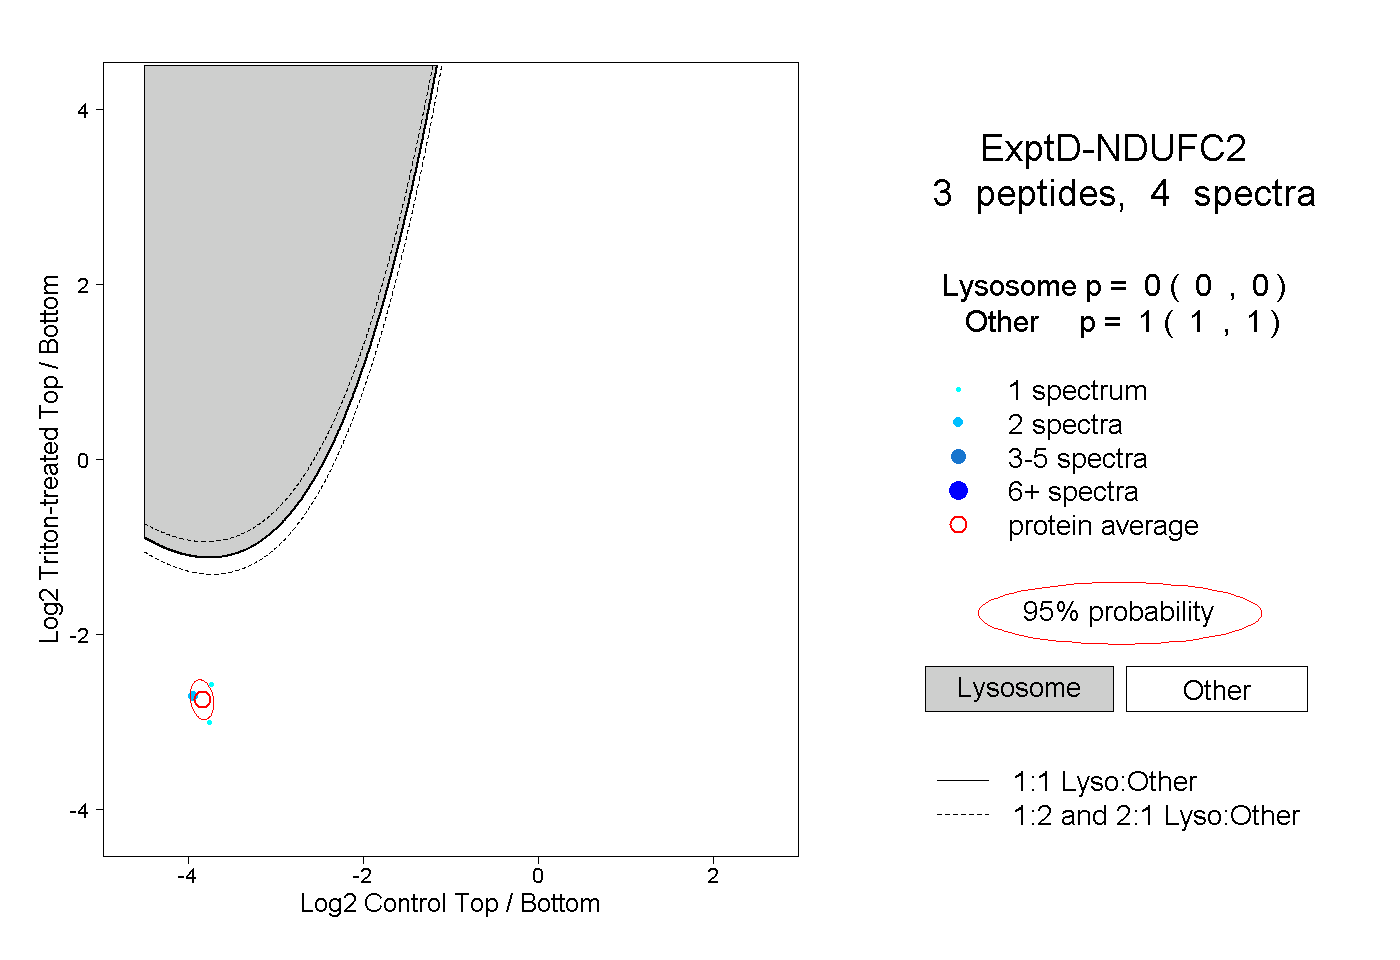
0.000 | 0.000
1.000 | 1.000