 5
5peptides
spectra

0.753 | 0.819
0.000 | 0.000
0.021 | 0.075
0.000 | 0.125
0.000 | 0.000
0.000 | 0.182
0.000 | 0.000
0.000 | 0.000
| Plot | Mito | Lyso | Perox | ER | Golgi | PM | Cytosol | Nucleus | |||||
| Expt A |
5 peptides |
14 spectra |
|
0.789 0.753 | 0.819 |
0.000 0.000 | 0.000 |
0.052 0.021 | 0.075 |
0.041 0.000 | 0.125 |
0.000 0.000 | 0.000 |
0.118 0.000 | 0.182 |
0.000 0.000 | 0.000 |
0.000 0.000 | 0.000 |
| 1 spectrum, LHPEDFPEK | 0.905 | 0.000 | 0.000 | 0.095 | 0.000 | 0.000 | 0.000 | 0.000 | ||
| 2 spectra, DHDMFGYIK | 0.959 | 0.000 | 0.041 | 0.000 | 0.000 | 0.000 | 0.000 | 0.000 | ||
| 3 spectra, TYAEILEPFHPVR | 0.720 | 0.000 | 0.000 | 0.267 | 0.000 | 0.000 | 0.000 | 0.013 | ||
| 2 spectra, QNYLYAVR | 0.665 | 0.192 | 0.000 | 0.000 | 0.000 | 0.141 | 0.000 | 0.002 | ||
| 6 spectra, FLPDEAR | 0.657 | 0.028 | 0.000 | 0.000 | 0.000 | 0.315 | 0.000 | 0.000 |
| Plot | Mito | Lyso or Perox | ER | Golgi | PM | Cytosol | Nucleus | ||||||
| Expt B |
5 peptides |
19 spectra |
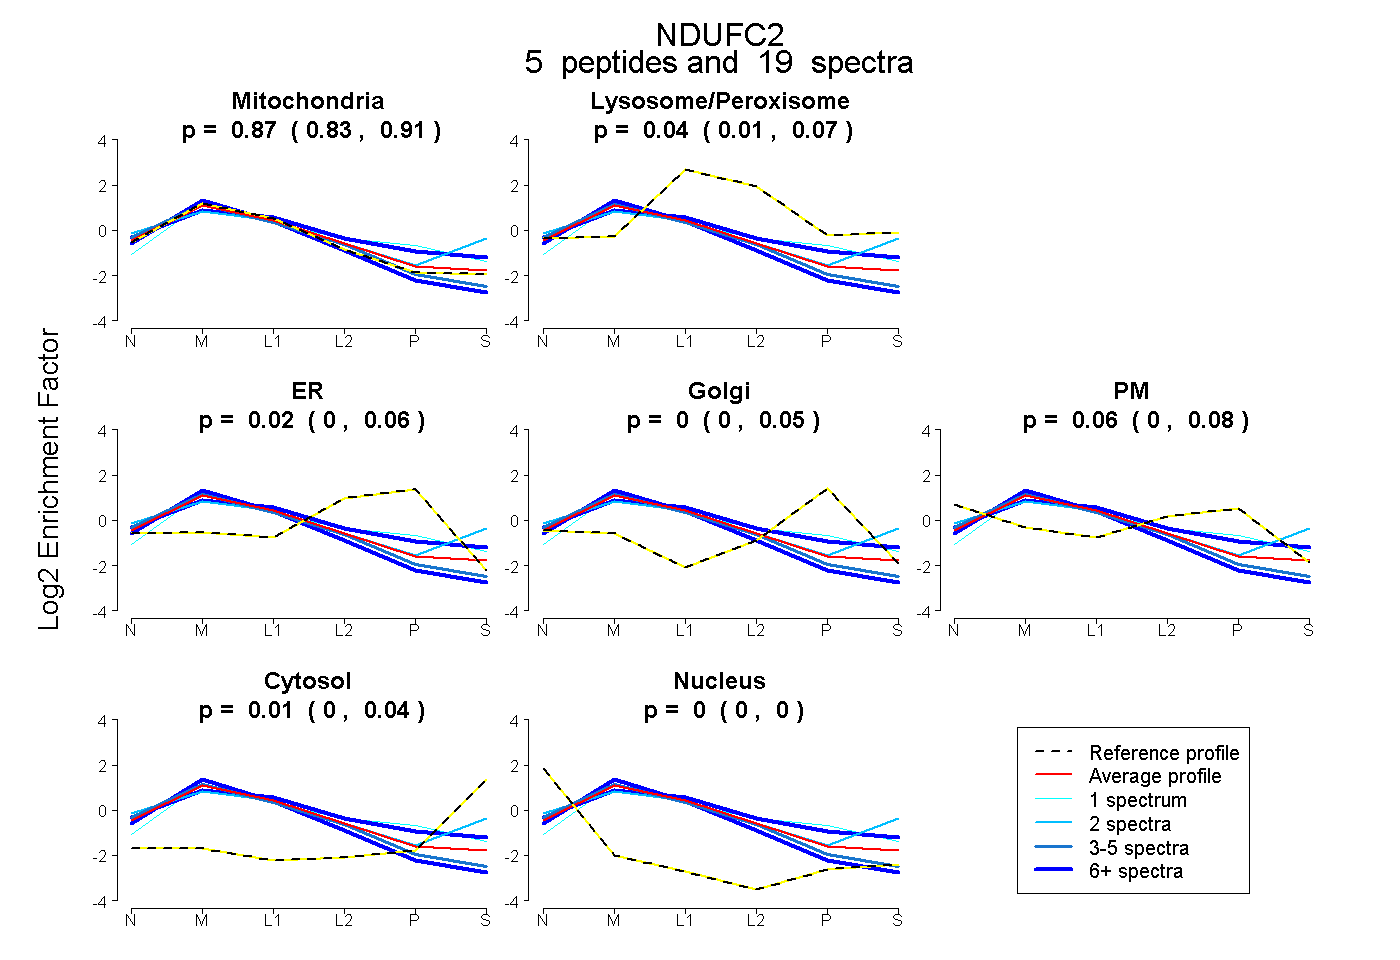 |
0.872 0.830 | 0.906 |
0.041 0.007 | 0.073 |
0.016 0.000 | 0.064 |
0.000 0.000 | 0.047 |
0.058 0.000 | 0.079 |
0.012 0.000 | 0.036 |
0.000 0.000 | 0.000 |
|||
| Plot | Lyso | Other | |||||||||||
| Expt C |
6 peptides |
147 spectra |
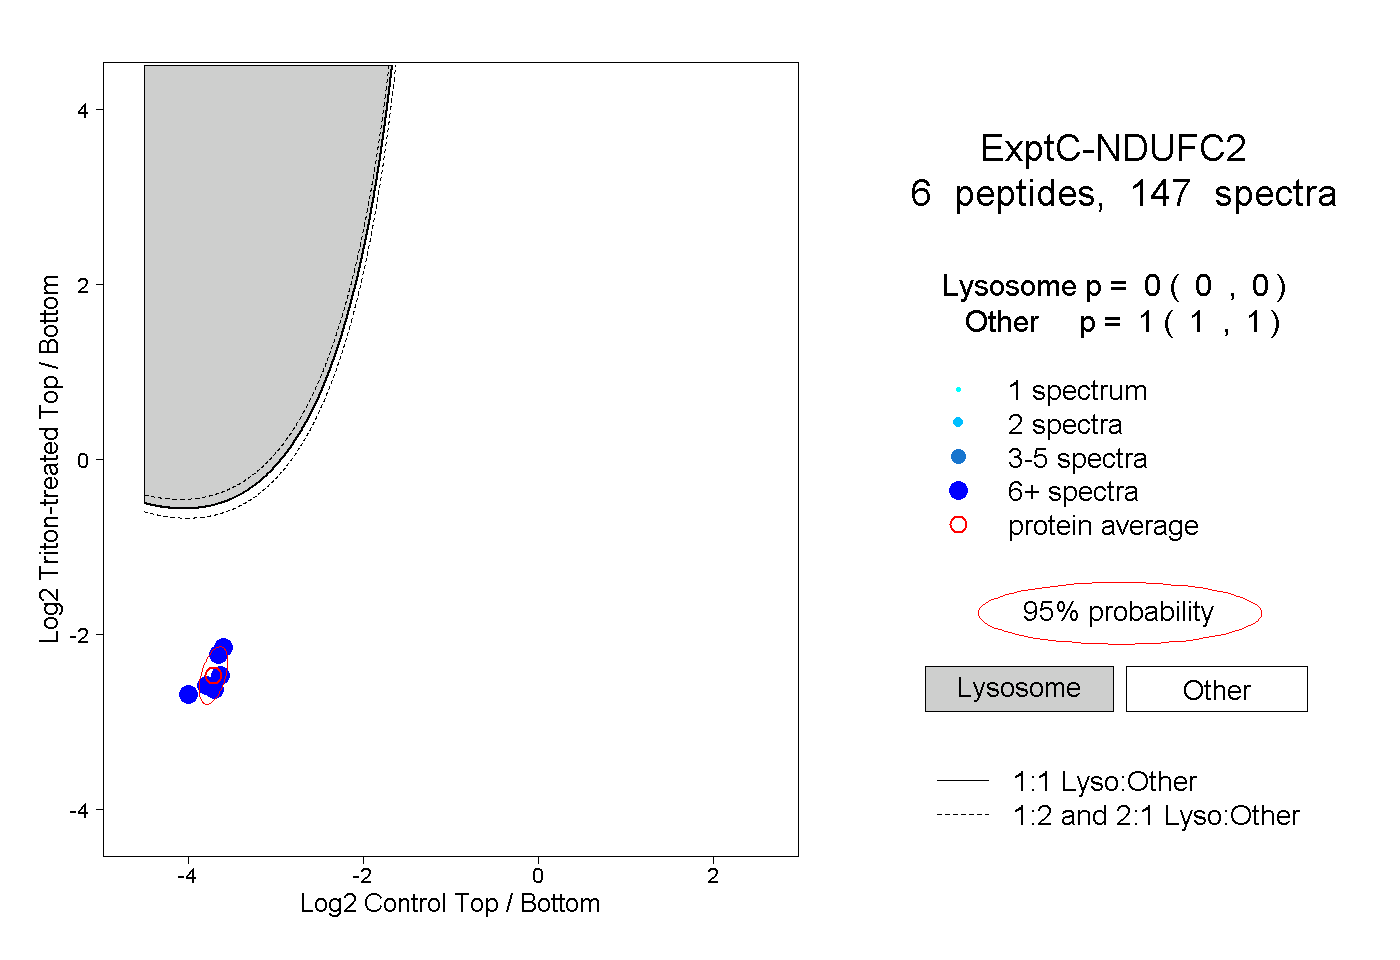 |
0.000 0.000 | 0.000 |
1.000 1.000 | 1.000 |
||||||||
| Plot | Lyso | Other | |||||||||||
| Expt D |
3 peptides |
4 spectra |
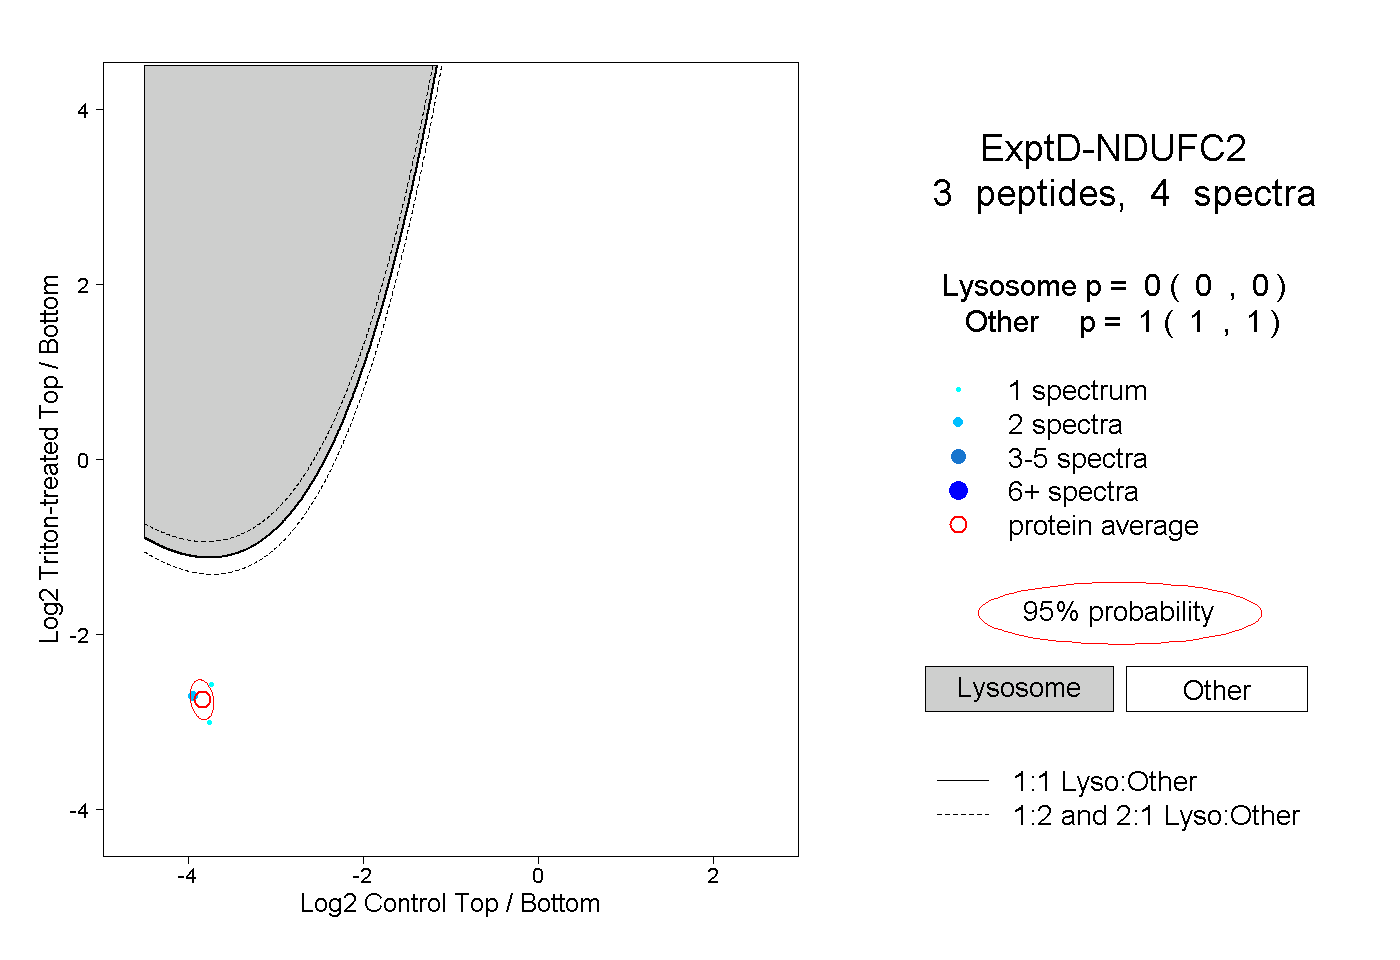 |
0.000 0.000 | 0.000 |
1.000 1.000 | 1.000 |