 9
9peptides
spectra
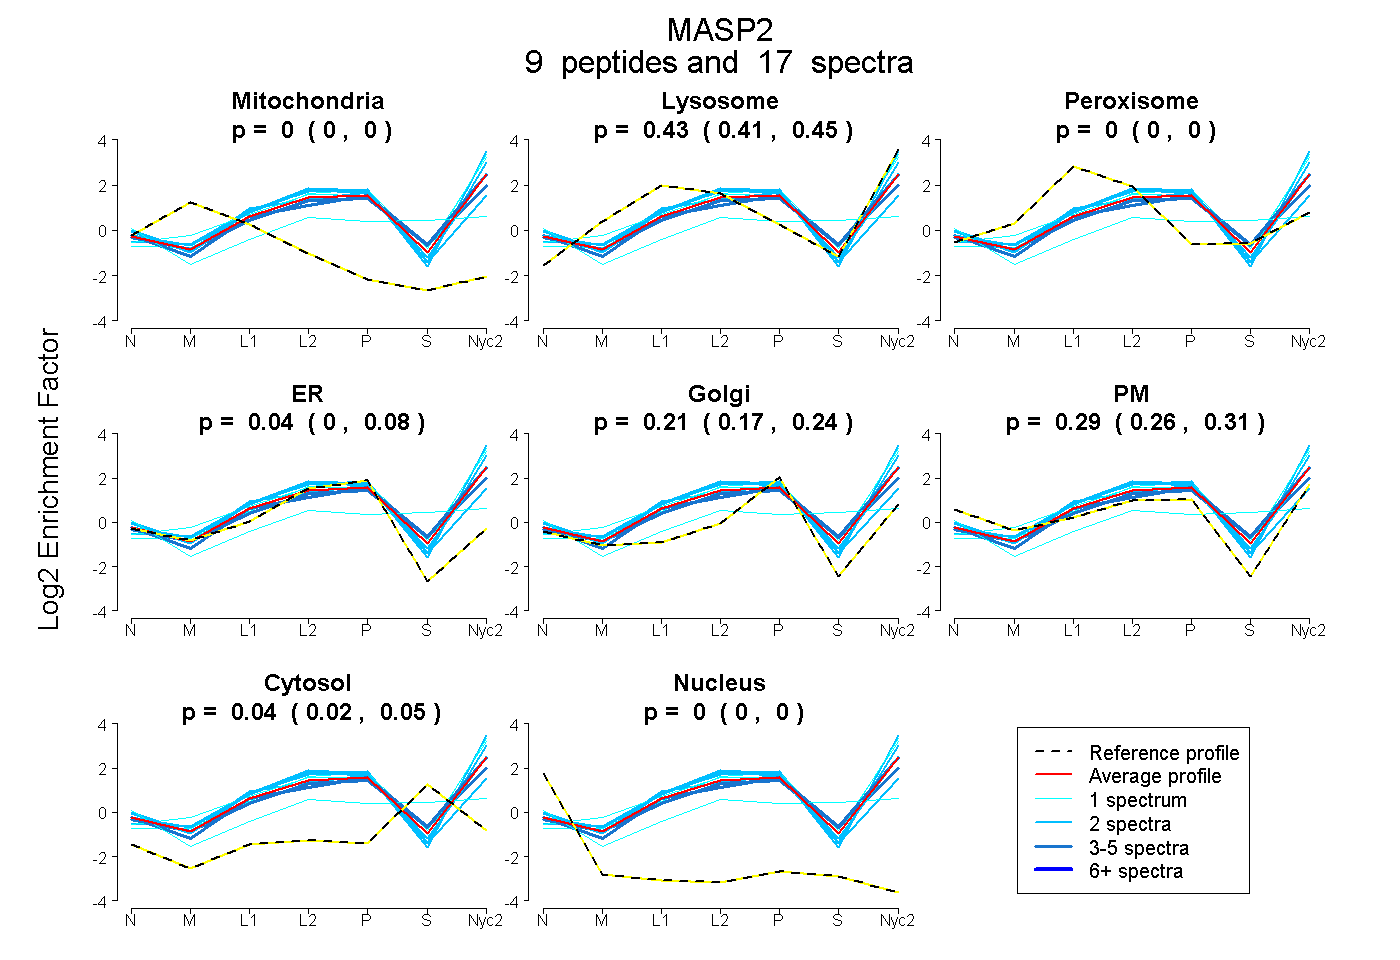
0.000 | 0.000
0.411 | 0.448
0.000 | 0.000
0.000 | 0.080
0.169 | 0.242
0.255 | 0.311
0.022 | 0.047
0.000 | 0.000
2peptides
spectra
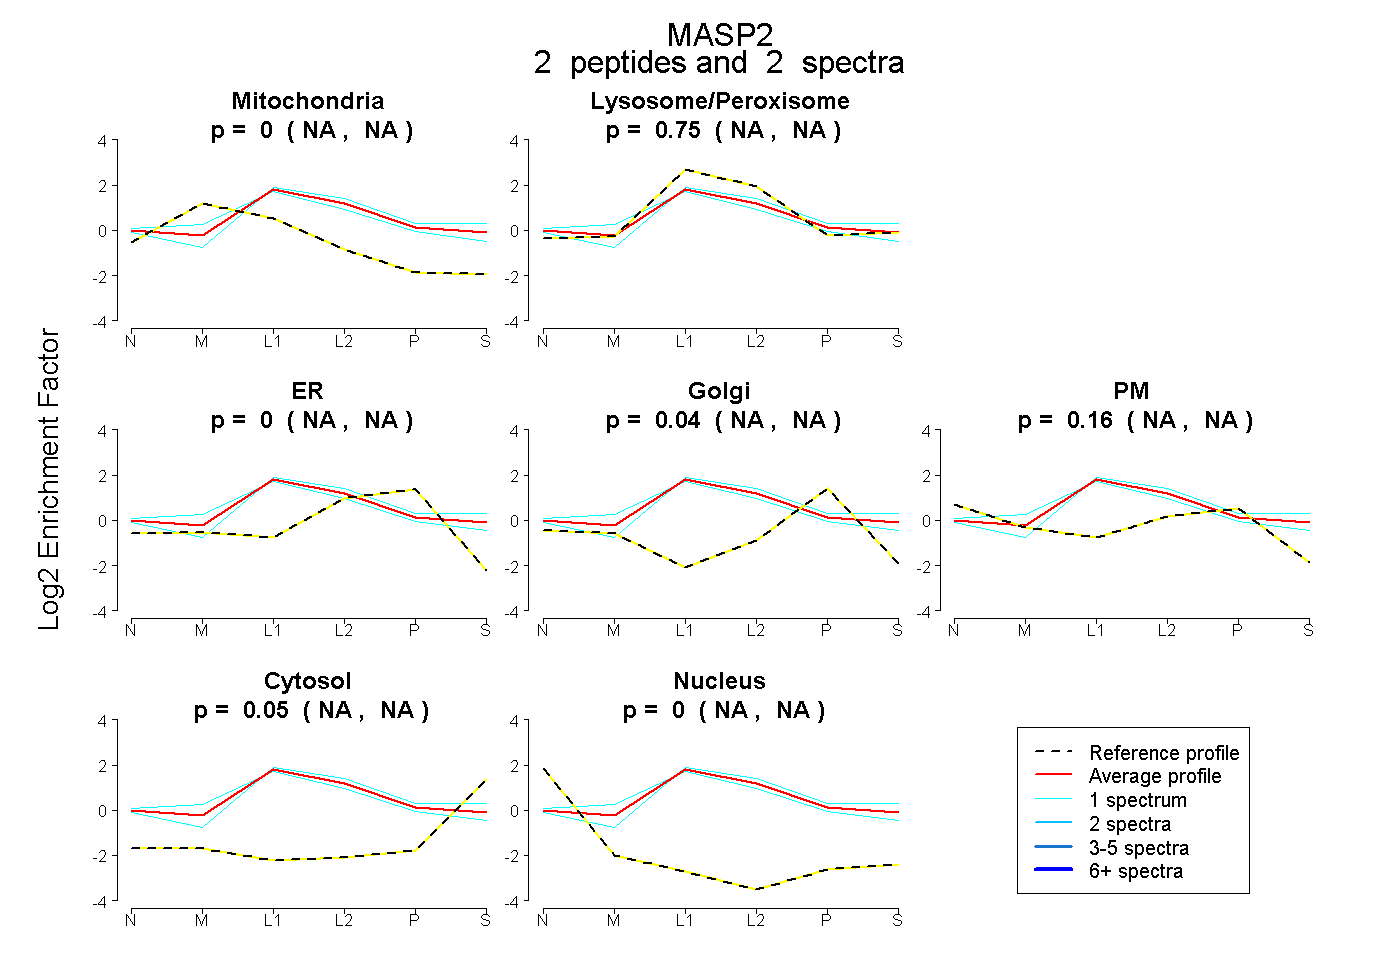
NA | NA
NA | NA
NA | NA
NA | NA
NA | NA
NA | NA
NA | NA
13peptides
spectra
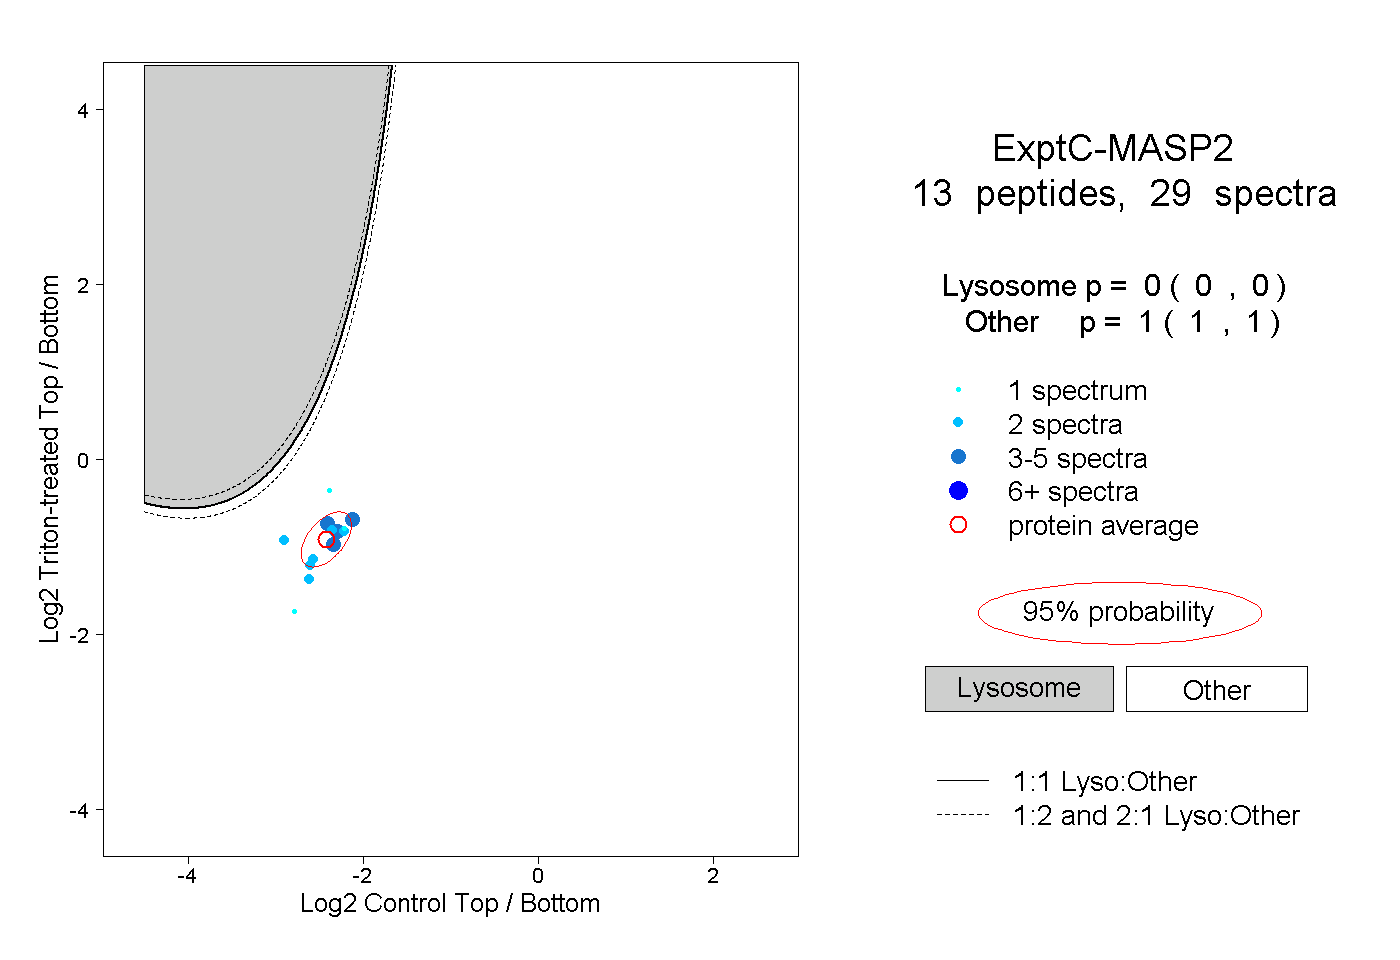
0.000 | 0.000
1.000 | 1.000
2peptides
spectra
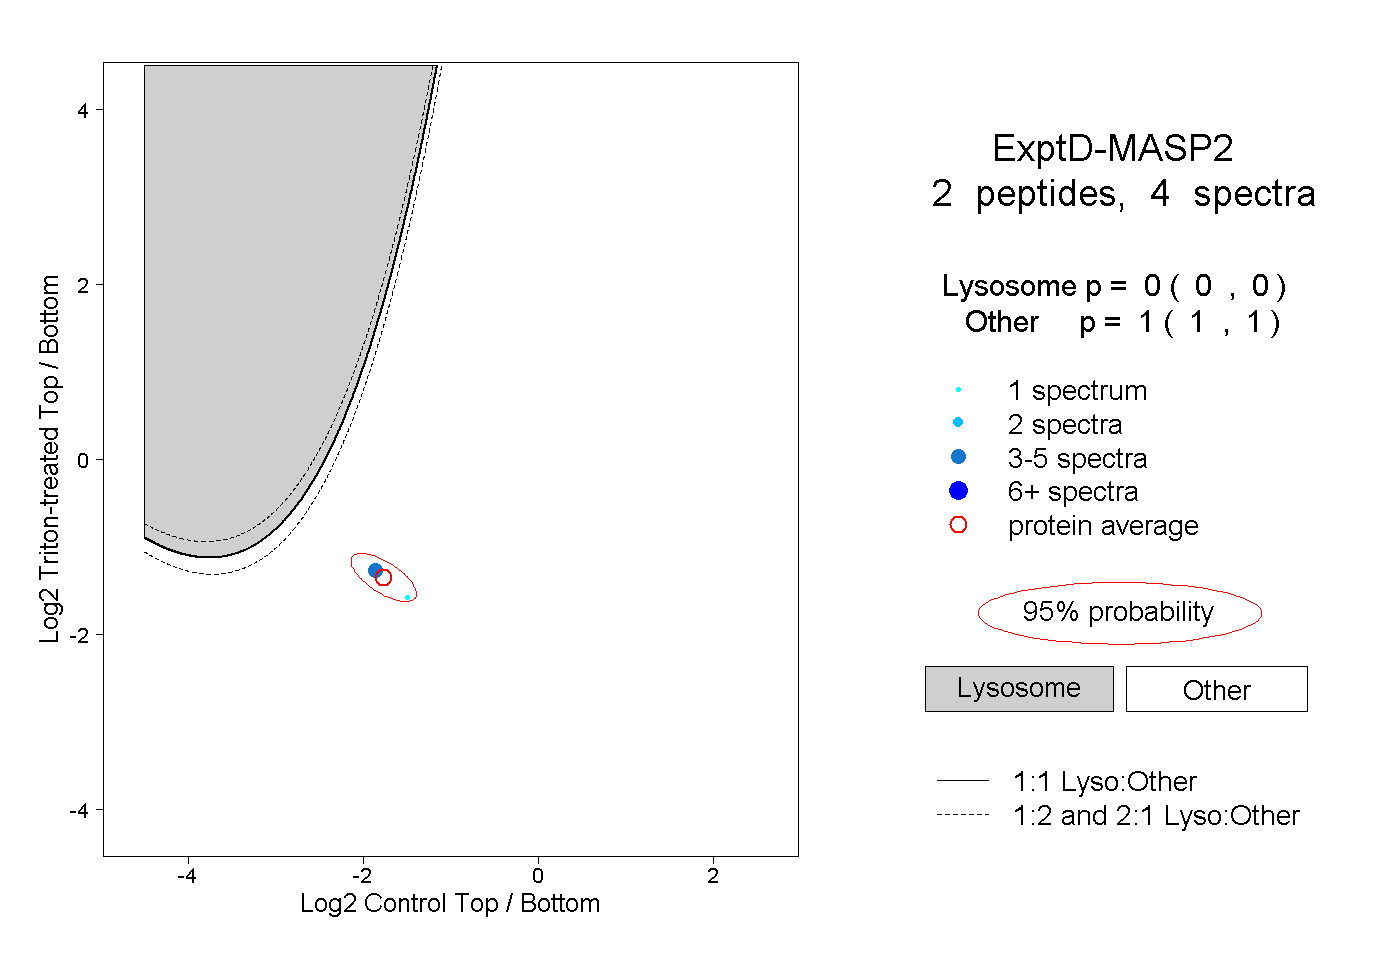
0.000 | 0.000
1.000 | 1.000