 9
9peptides
spectra
0.000 | 0.000
0.411 | 0.448
0.000 | 0.000
0.000 | 0.080
0.169 | 0.242
0.255 | 0.311
0.022 | 0.047
0.000 | 0.000
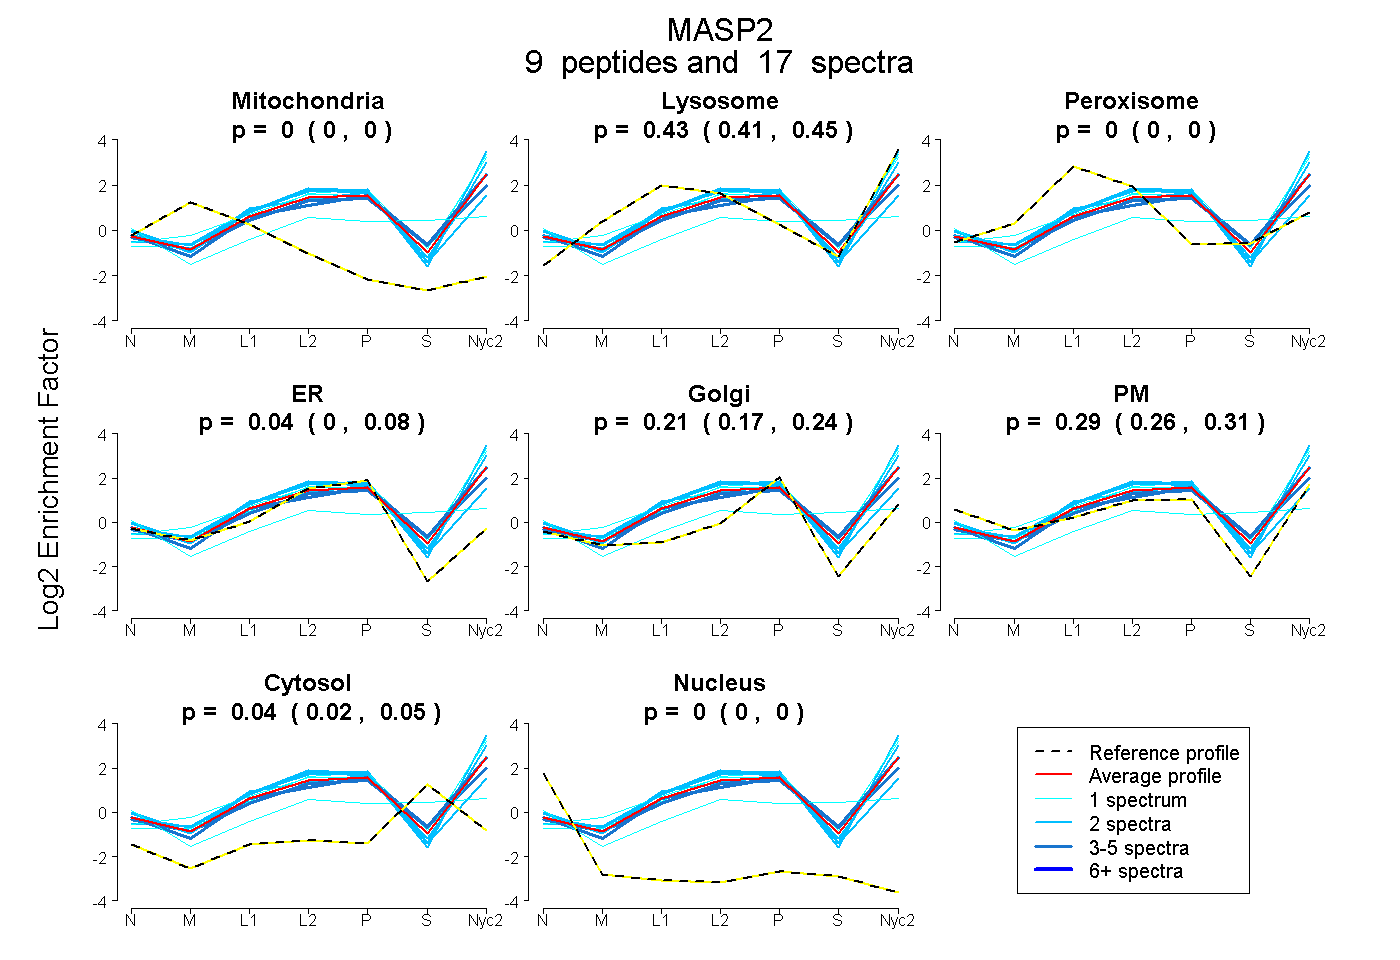
| Plot | Mito | Lyso | Perox | ER | Golgi | PM | Cytosol | Nucleus | |||||
| Expt A |
9 peptides |
17 spectra |
|
0.000 0.000 | 0.000 |
0.432 0.411 | 0.448 |
0.000 0.000 | 0.000 |
0.036 0.000 | 0.080 |
0.211 0.169 | 0.242 |
0.285 0.255 | 0.311 |
0.036 0.022 | 0.047 |
0.000 0.000 | 0.000 |
| 3 spectra, NIMPICLPR | 0.000 | 0.380 | 0.000 | 0.130 | 0.140 | 0.231 | 0.120 | 0.000 | ||
| 2 spectra, LVSPGFPEK | 0.000 | 0.538 | 0.000 | 0.018 | 0.214 | 0.230 | 0.000 | 0.000 | ||
| 3 spectra, VGYILHQNK | 0.000 | 0.424 | 0.000 | 0.000 | 0.242 | 0.242 | 0.091 | 0.000 | ||
| 1 spectrum, YGNHQDR | 0.000 | 0.000 | 0.105 | 0.000 | 0.000 | 0.432 | 0.463 | 0.000 | ||
| 2 spectra, SWTLTAPPGFR | 0.000 | 0.454 | 0.000 | 0.000 | 0.013 | 0.533 | 0.000 | 0.000 | ||
| 2 spectra, CEYDFVK | 0.000 | 0.208 | 0.124 | 0.236 | 0.162 | 0.270 | 0.000 | 0.000 | ||
| 2 spectra, VLATLCGQESTDTER | 0.000 | 0.453 | 0.000 | 0.161 | 0.087 | 0.299 | 0.000 | 0.000 | ||
| 1 spectrum, TEAMSSLDIR | 0.000 | 0.621 | 0.000 | 0.000 | 0.186 | 0.193 | 0.000 | 0.000 | ||
| 1 spectrum, MGILK | 0.000 | 0.624 | 0.000 | 0.000 | 0.376 | 0.000 | 0.000 | 0.000 |
| Plot | Mito | Lyso or Perox | ER | Golgi | PM | Cytosol | Nucleus | ||||||
| Expt B |
2 peptides |
2 spectra |
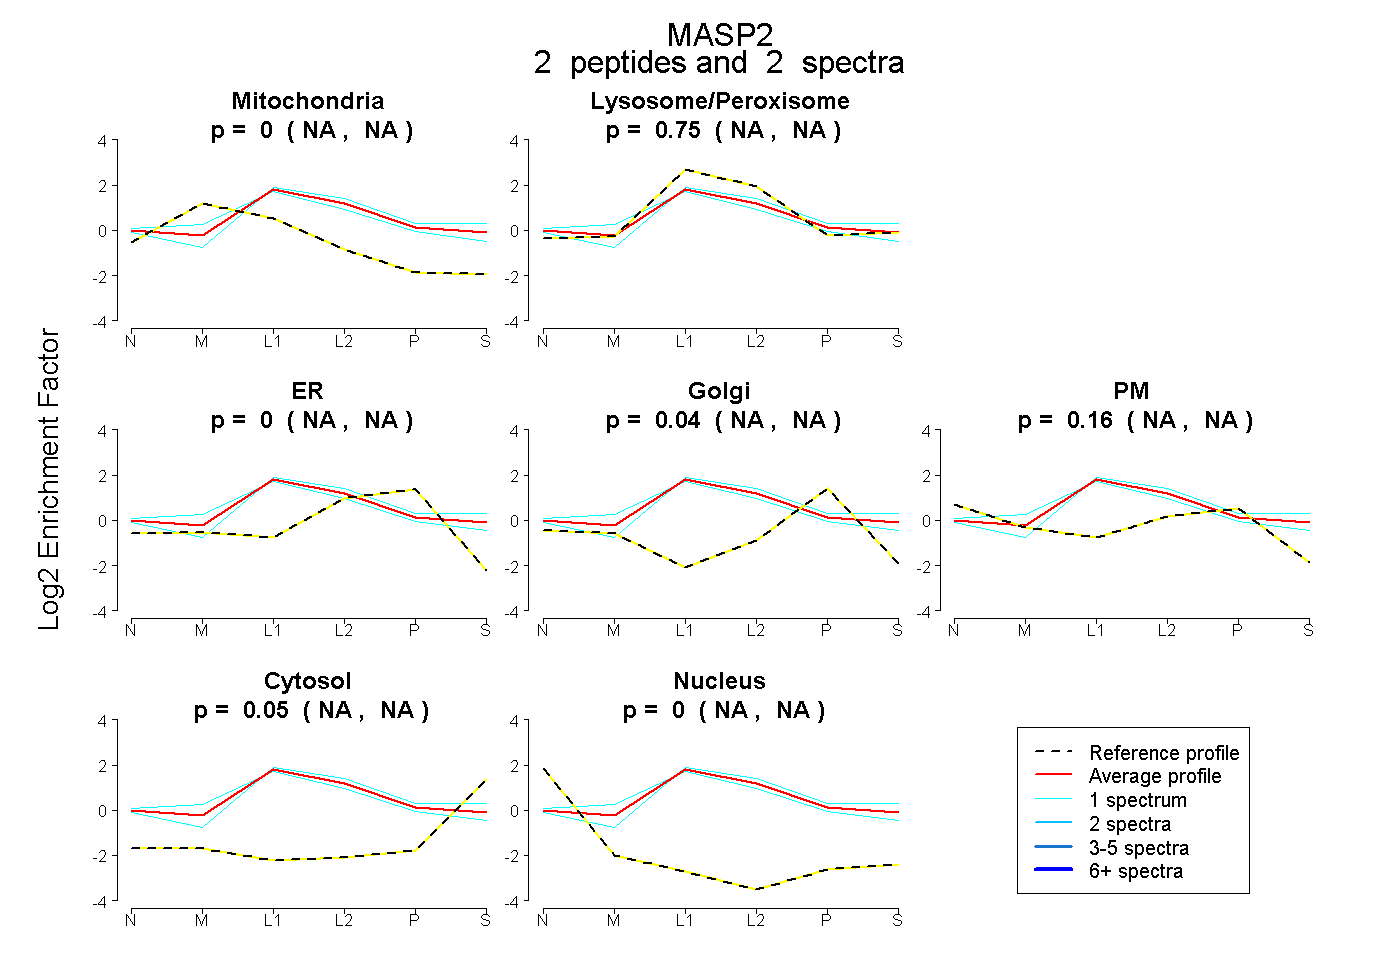 |
0.000 NA | NA |
0.755 NA | NA |
0.000 NA | NA |
0.037 NA | NA |
0.160 NA | NA |
0.048 NA | NA |
0.000 NA | NA |
|||
| Plot | Lyso | Other | |||||||||||
| Expt C |
13 peptides |
29 spectra |
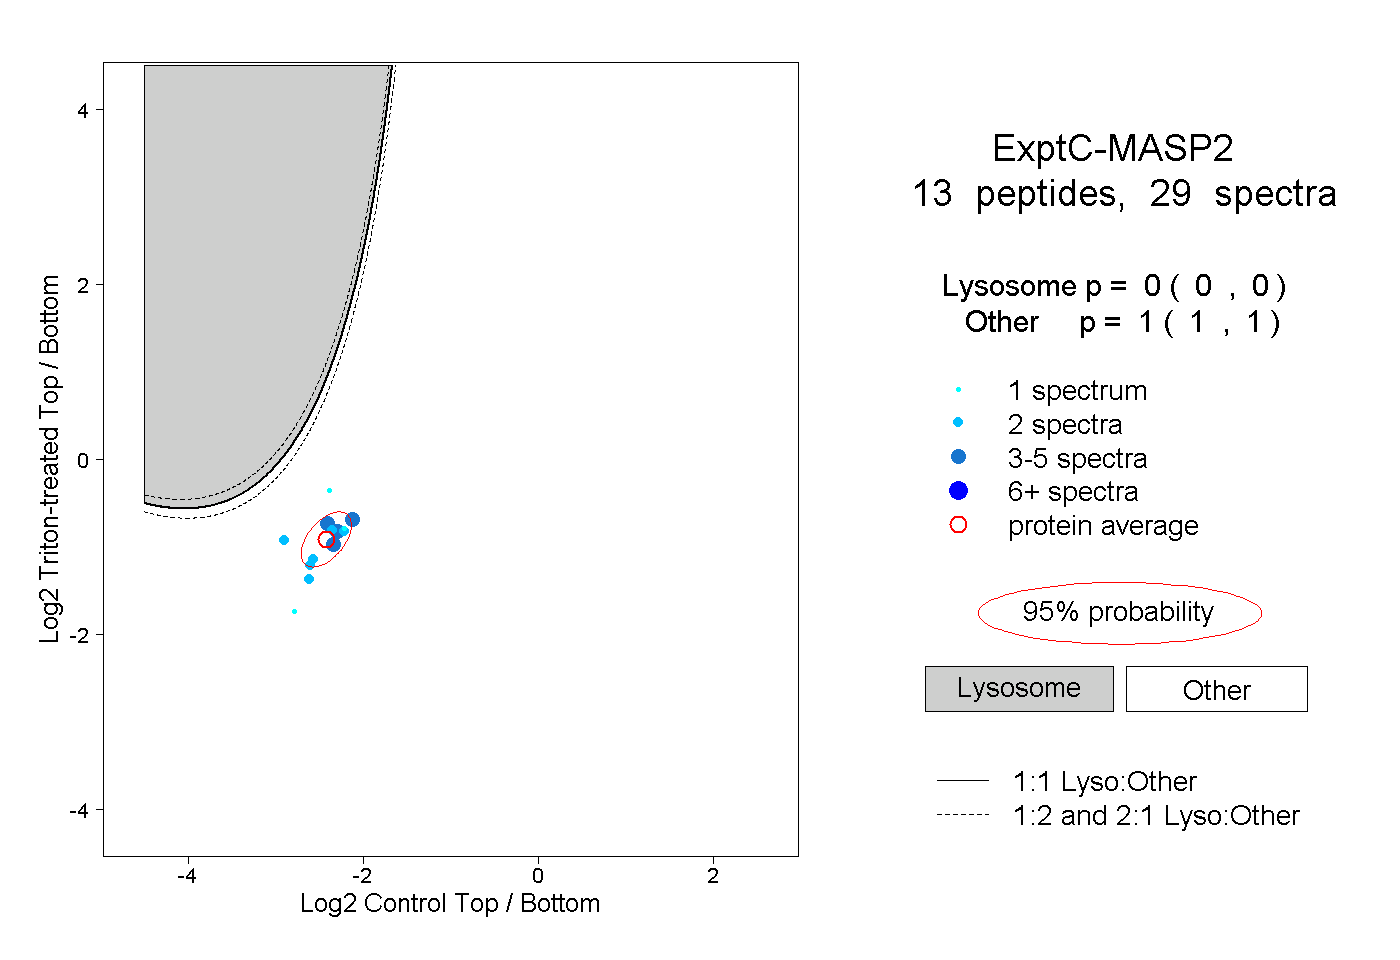 |
0.000 0.000 | 0.000 |
1.000 1.000 | 1.000 |
||||||||
| Plot | Lyso | Other | |||||||||||
| Expt D |
2 peptides |
4 spectra |
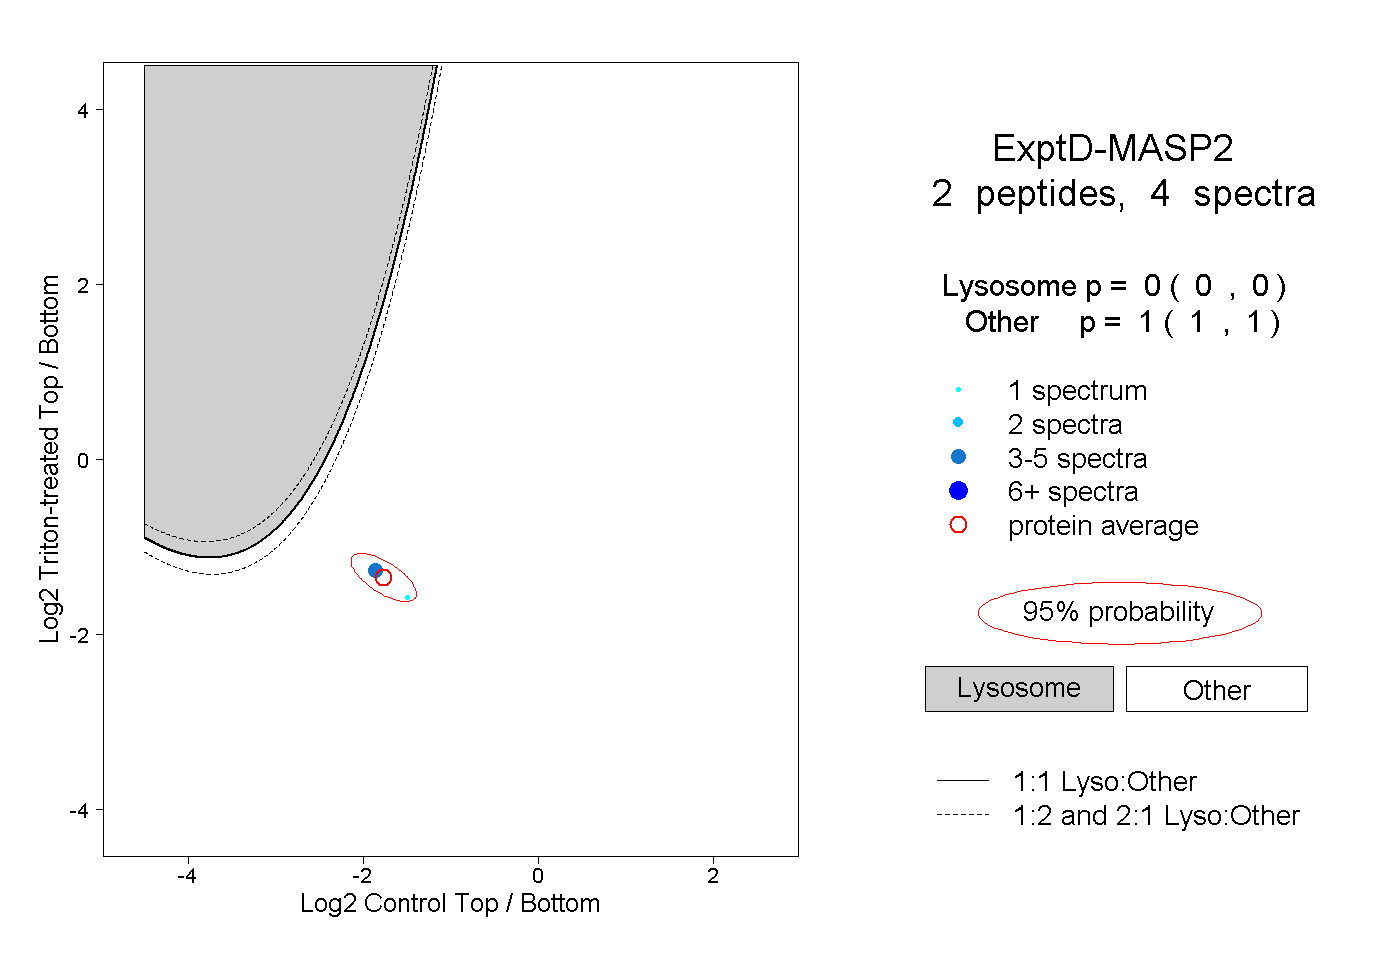 |
0.000 0.000 | 0.000 |
1.000 1.000 | 1.000 |