 5
5peptides
spectra
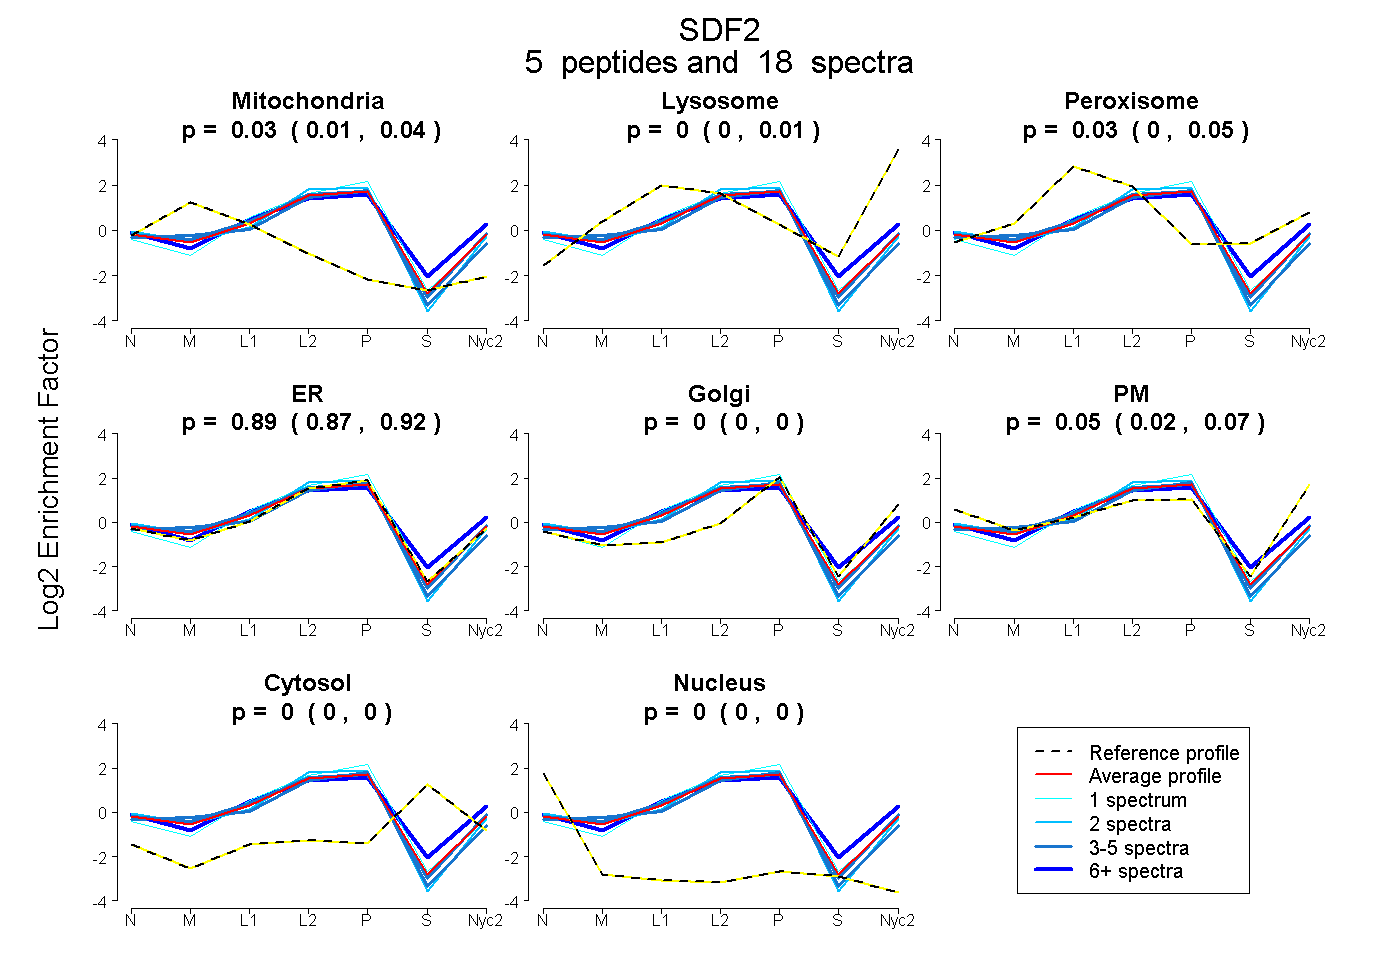
0.012 | 0.038
0.000 | 0.008
0.001 | 0.054
0.866 | 0.917
0.000 | 0.000
0.016 | 0.073
0.000 | 0.000
0.000 | 0.000
2peptides
spectra
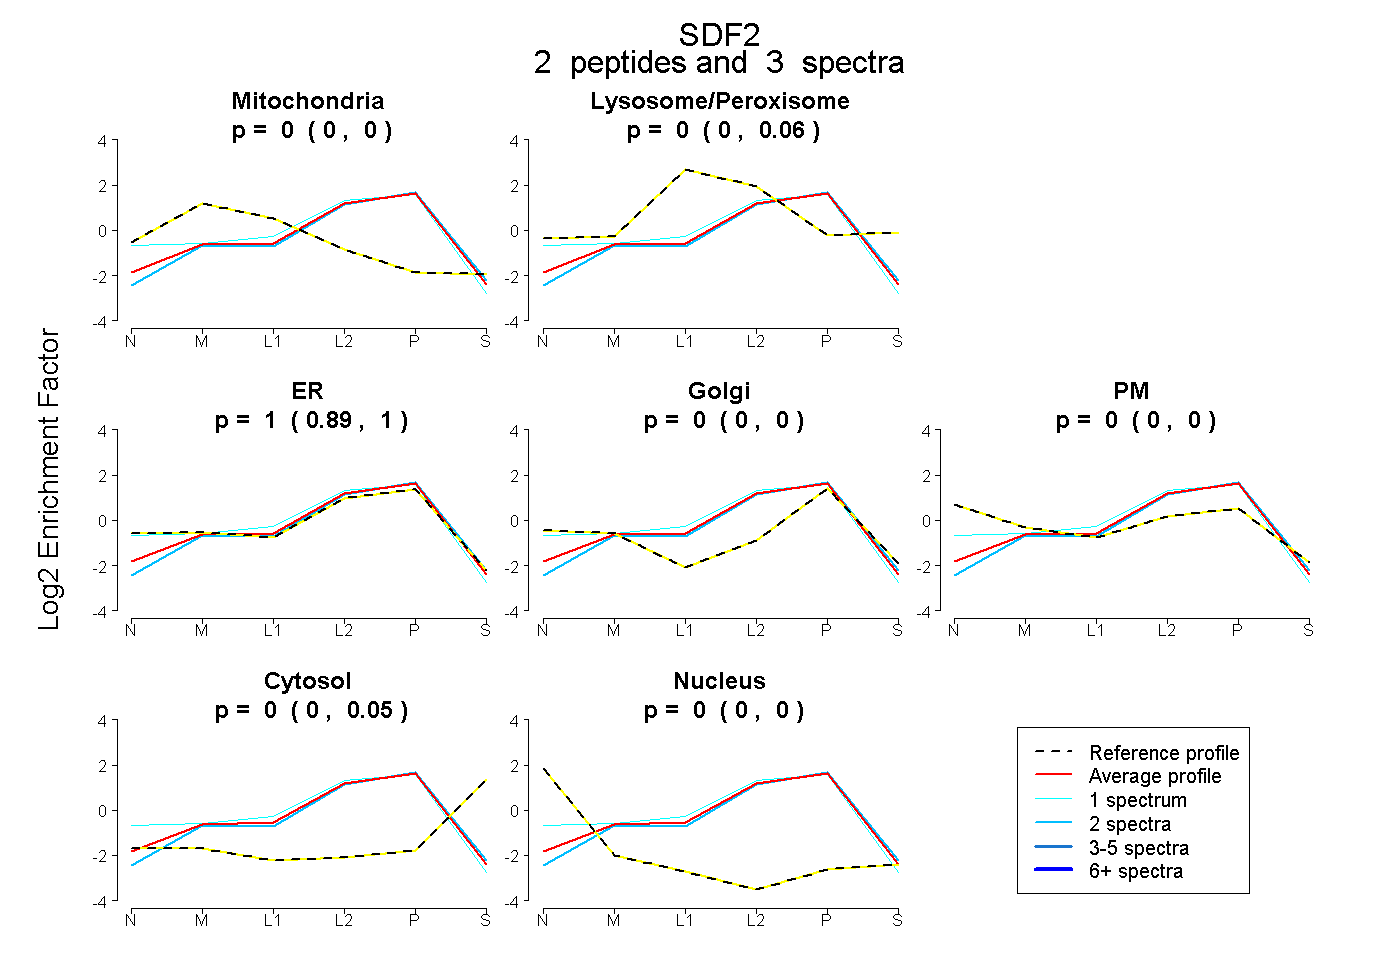
0.000 | 0.000
0.000 | 0.055
0.890 | 1.000
0.000 | 0.000
0.000 | 0.000
0.000 | 0.051
0.000 | 0.000
3peptides
spectra
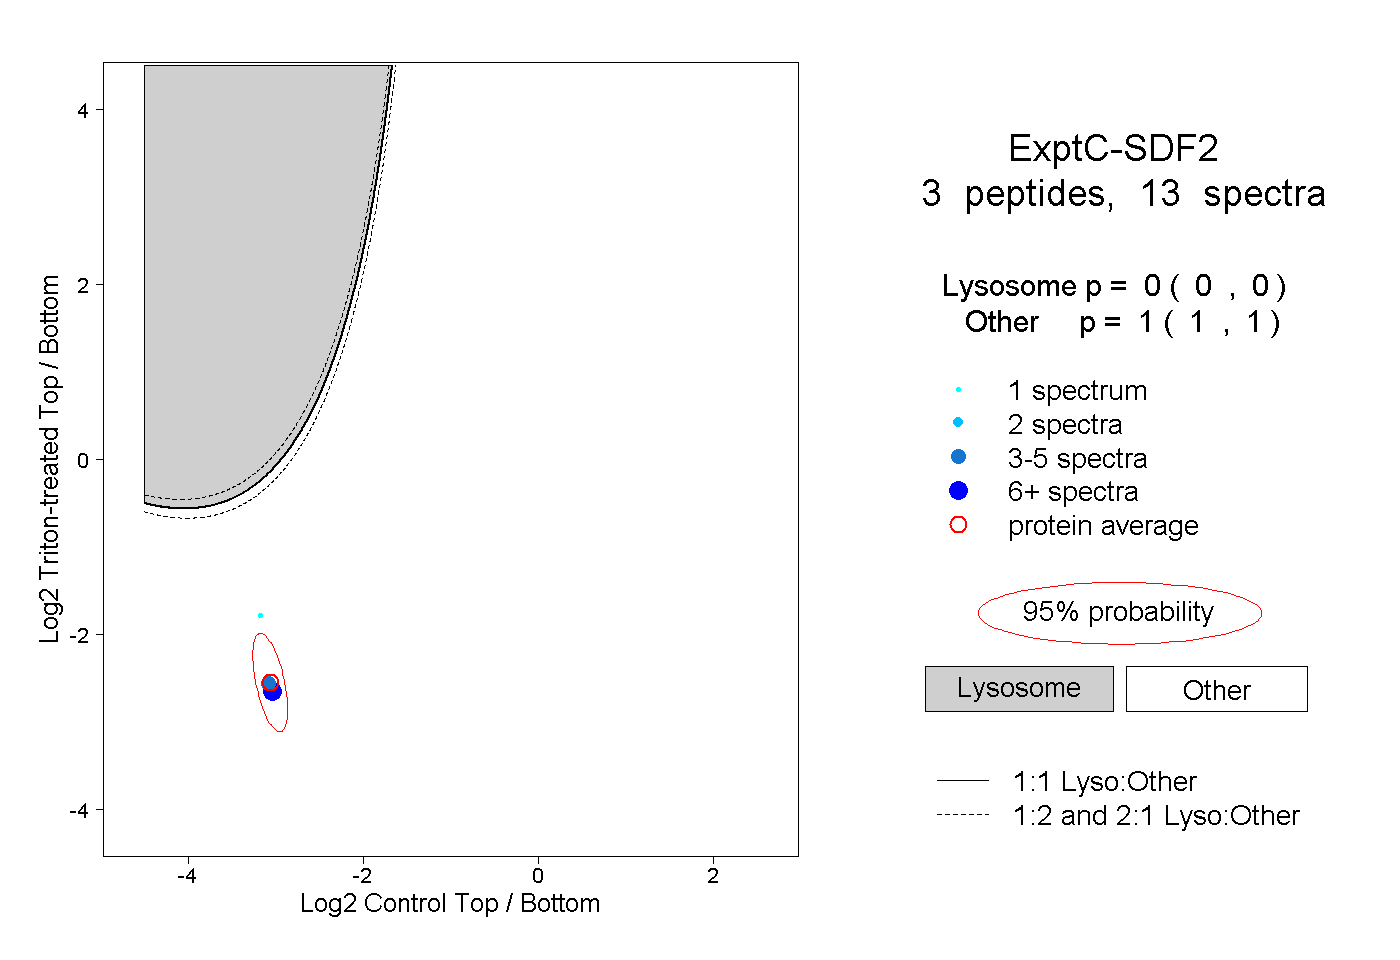
0.000 | 0.000
1.000 | 1.000
3peptides
spectra
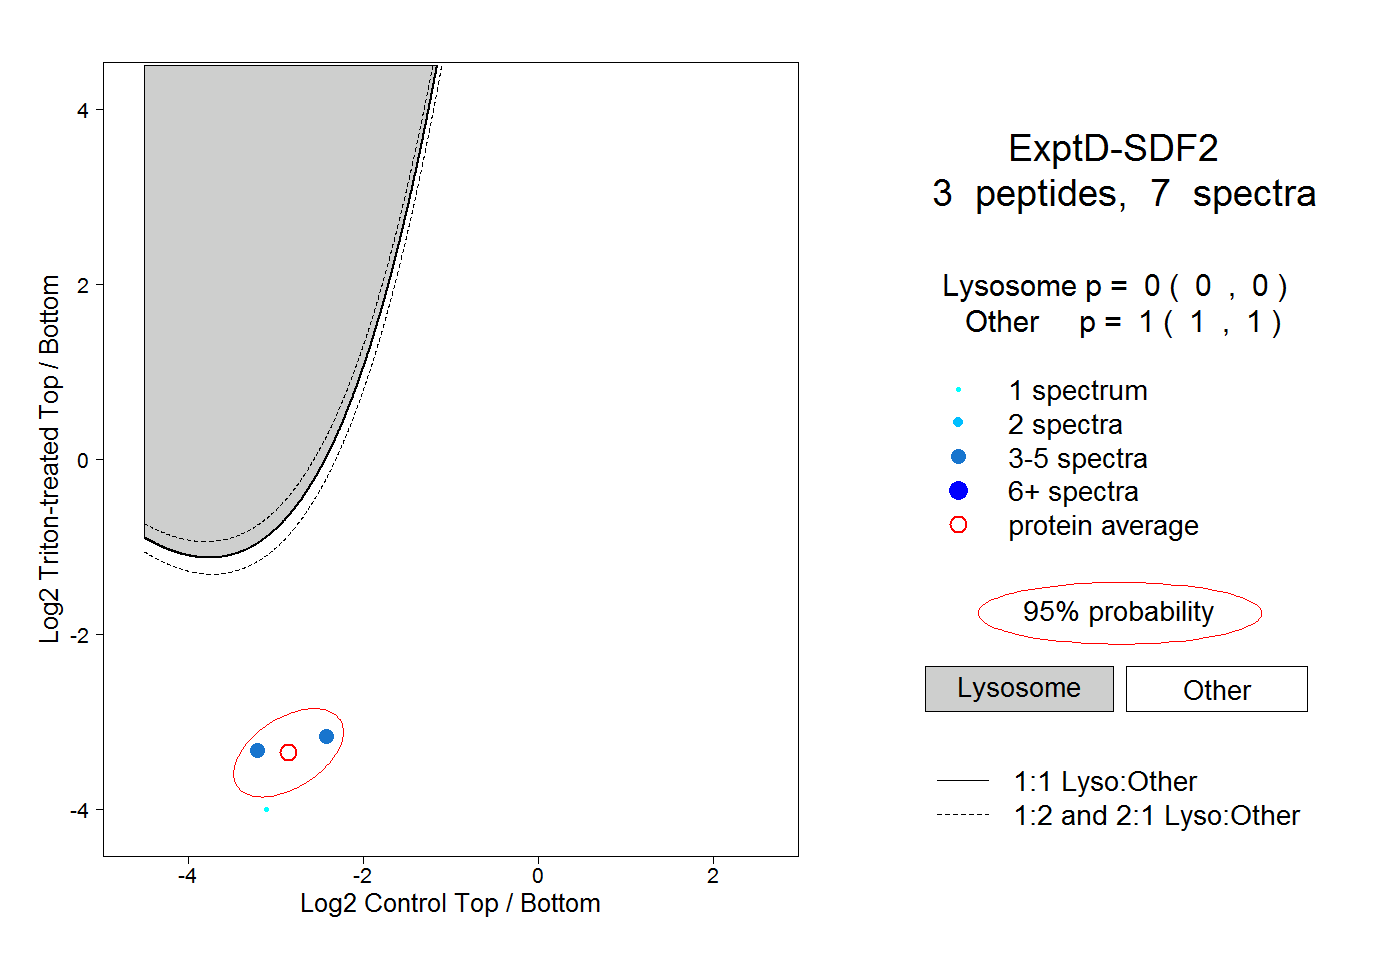
0.000 | 0.000
1.000 | 1.000