 5
5peptides
spectra
0.012 | 0.038
0.000 | 0.008
0.001 | 0.054
0.866 | 0.917
0.000 | 0.000
0.016 | 0.073
0.000 | 0.000
0.000 | 0.000
| Plot | Mito | Lyso | Perox | ER | Golgi | PM | Cytosol | Nucleus | |||||
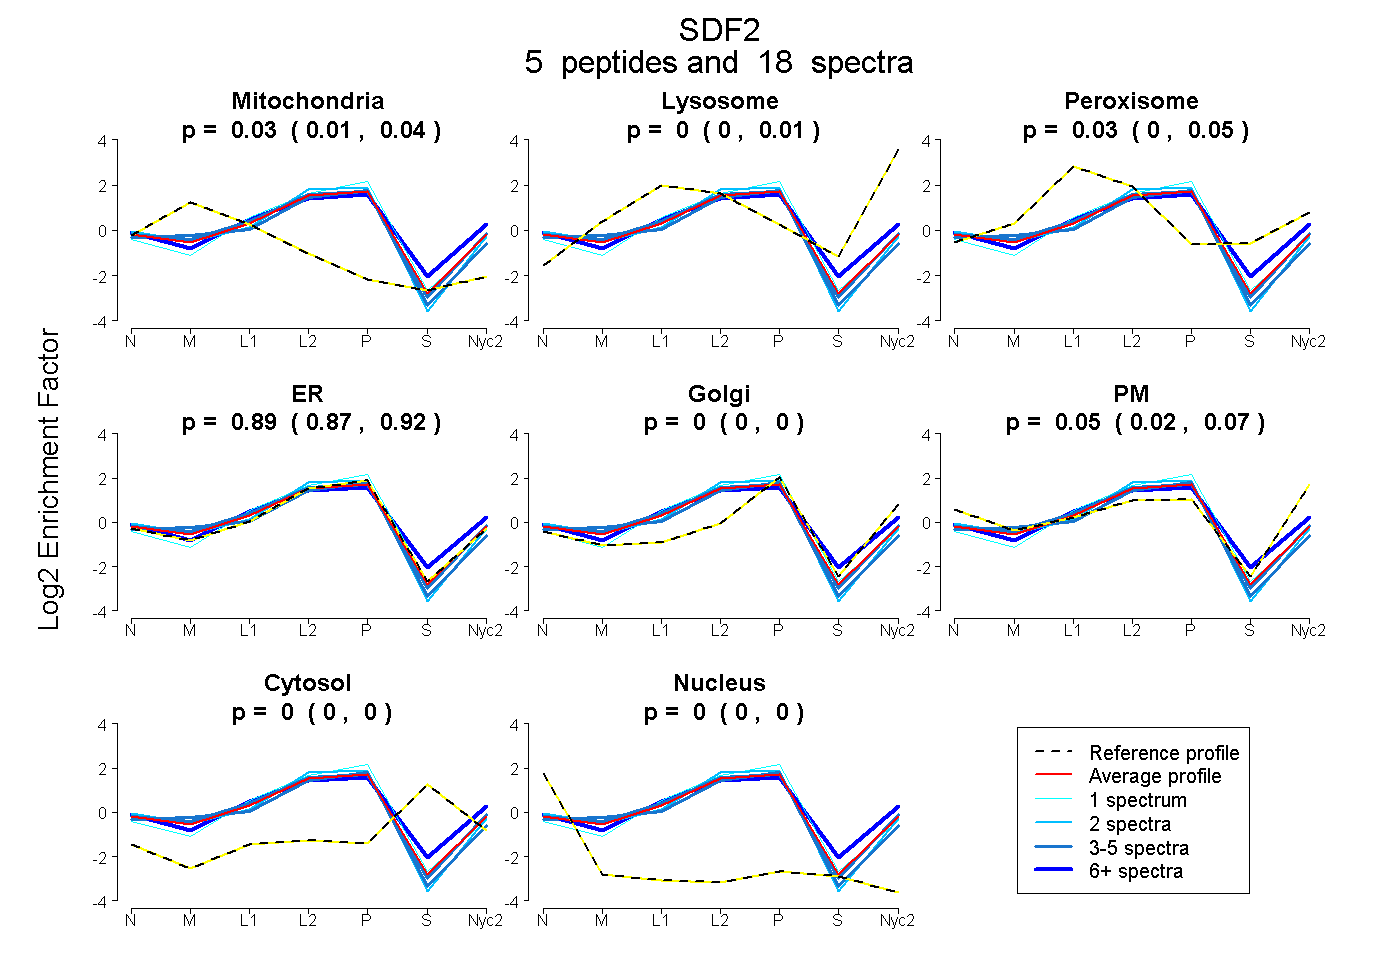
| Expt A |
5 peptides |
18 spectra |
|
0.026 0.012 | 0.038 |
0.000 0.000 | 0.008 |
0.032 0.001 | 0.054 |
0.892 0.866 | 0.917 |
0.000 0.000 | 0.000 |
0.050 0.016 | 0.073 |
0.000 0.000 | 0.000 |
0.000 0.000 | 0.000 |
| 3 spectra, LTHINTGR | 0.027 | 0.012 | 0.026 | 0.870 | 0.000 | 0.065 | 0.000 | 0.000 | ||
| 1 spectrum, AMEGIFMKPSELLR | 0.000 | 0.000 | 0.019 | 0.981 | 0.000 | 0.000 | 0.000 | 0.000 | ||
| 7 spectra, AEVHHAEL | 0.000 | 0.000 | 0.154 | 0.642 | 0.075 | 0.115 | 0.014 | 0.000 | ||
| 2 spectra, CGQPIR | 0.002 | 0.000 | 0.000 | 0.998 | 0.000 | 0.000 | 0.000 | 0.000 | ||
| 5 spectra, TATVCER | 0.082 | 0.000 | 0.000 | 0.918 | 0.000 | 0.000 | 0.000 | 0.000 |
| Plot | Mito | Lyso or Perox | ER | Golgi | PM | Cytosol | Nucleus | ||||||
| Expt B |
2 peptides |
3 spectra |
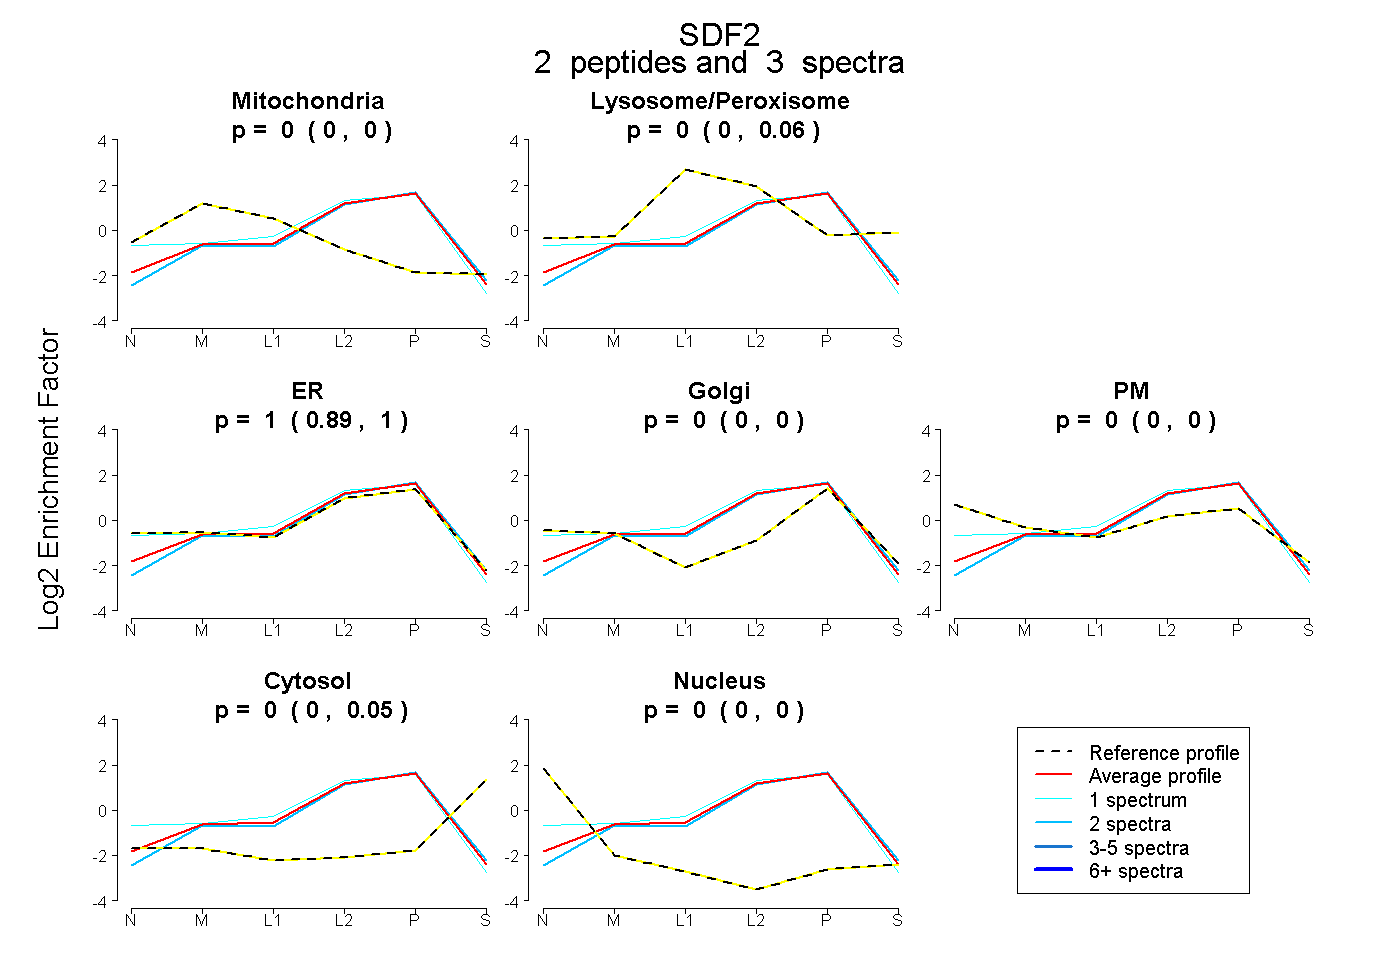 |
0.000 0.000 | 0.000 |
0.000 0.000 | 0.055 |
1.000 0.890 | 1.000 |
0.000 0.000 | 0.000 |
0.000 0.000 | 0.000 |
0.000 0.000 | 0.051 |
0.000 0.000 | 0.000 |
|||
| Plot | Lyso | Other | |||||||||||
| Expt C |
3 peptides |
13 spectra |
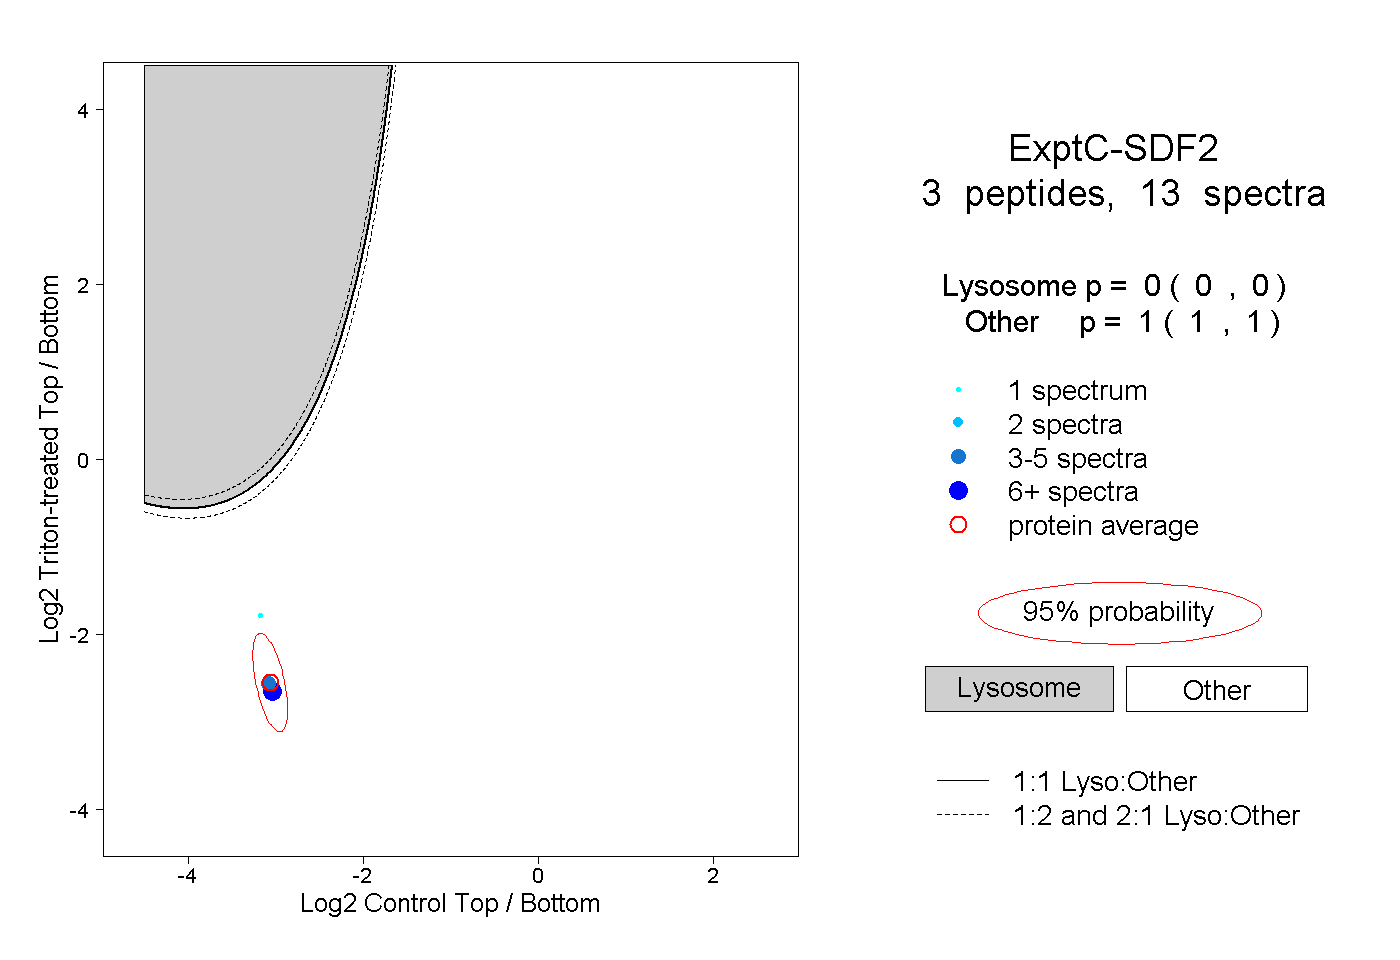 |
0.000 0.000 | 0.000 |
1.000 1.000 | 1.000 |
||||||||
| Plot | Lyso | Other | |||||||||||
| Expt D |
3 peptides |
7 spectra |
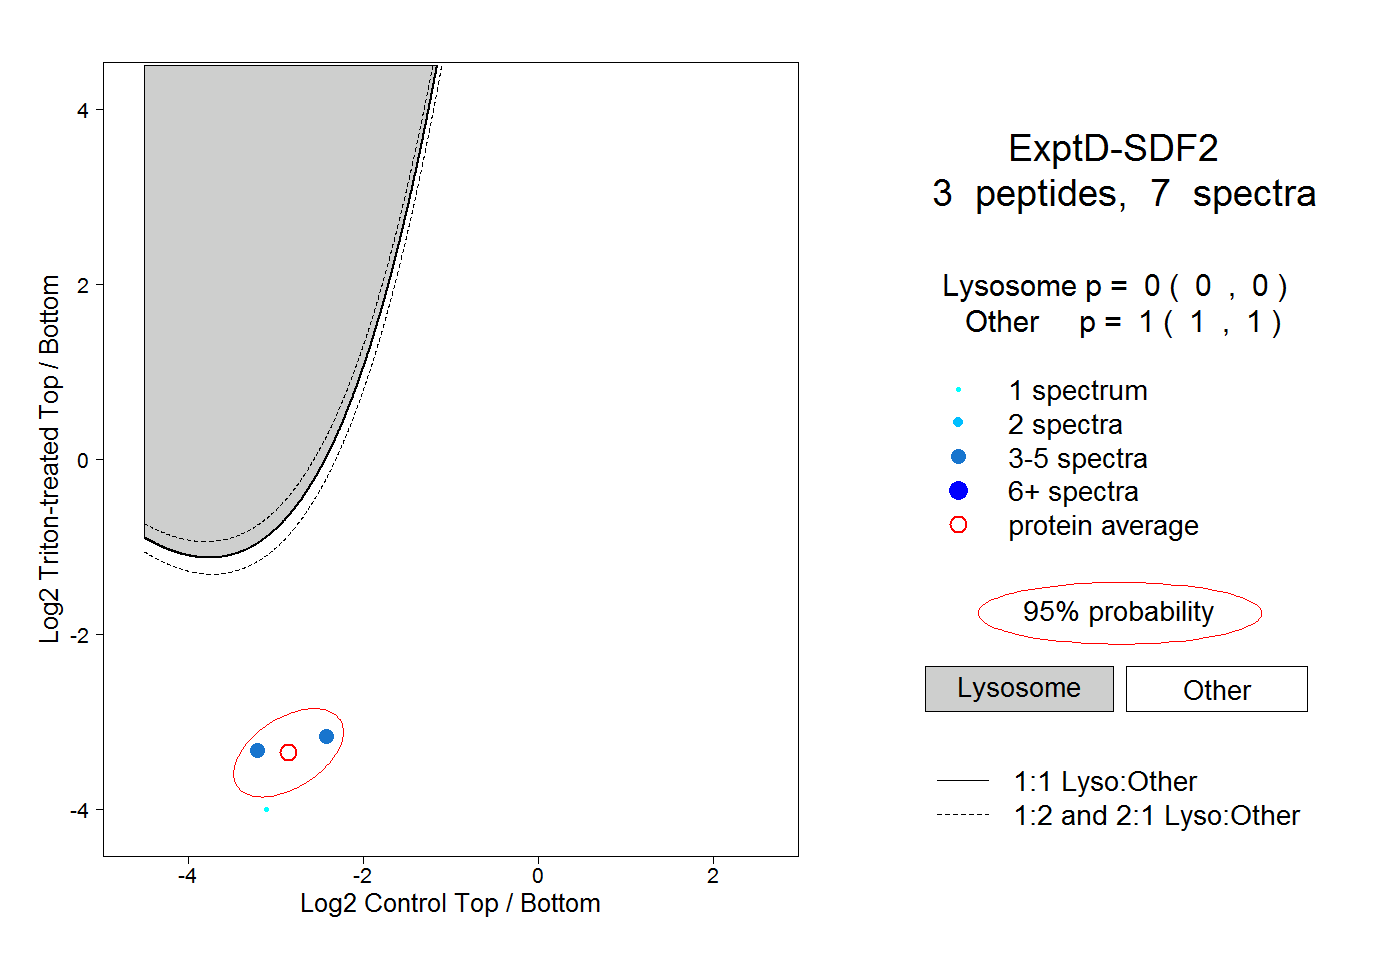 |
0.000 0.000 | 0.000 |
1.000 1.000 | 1.000 |