 4
4peptides
spectra
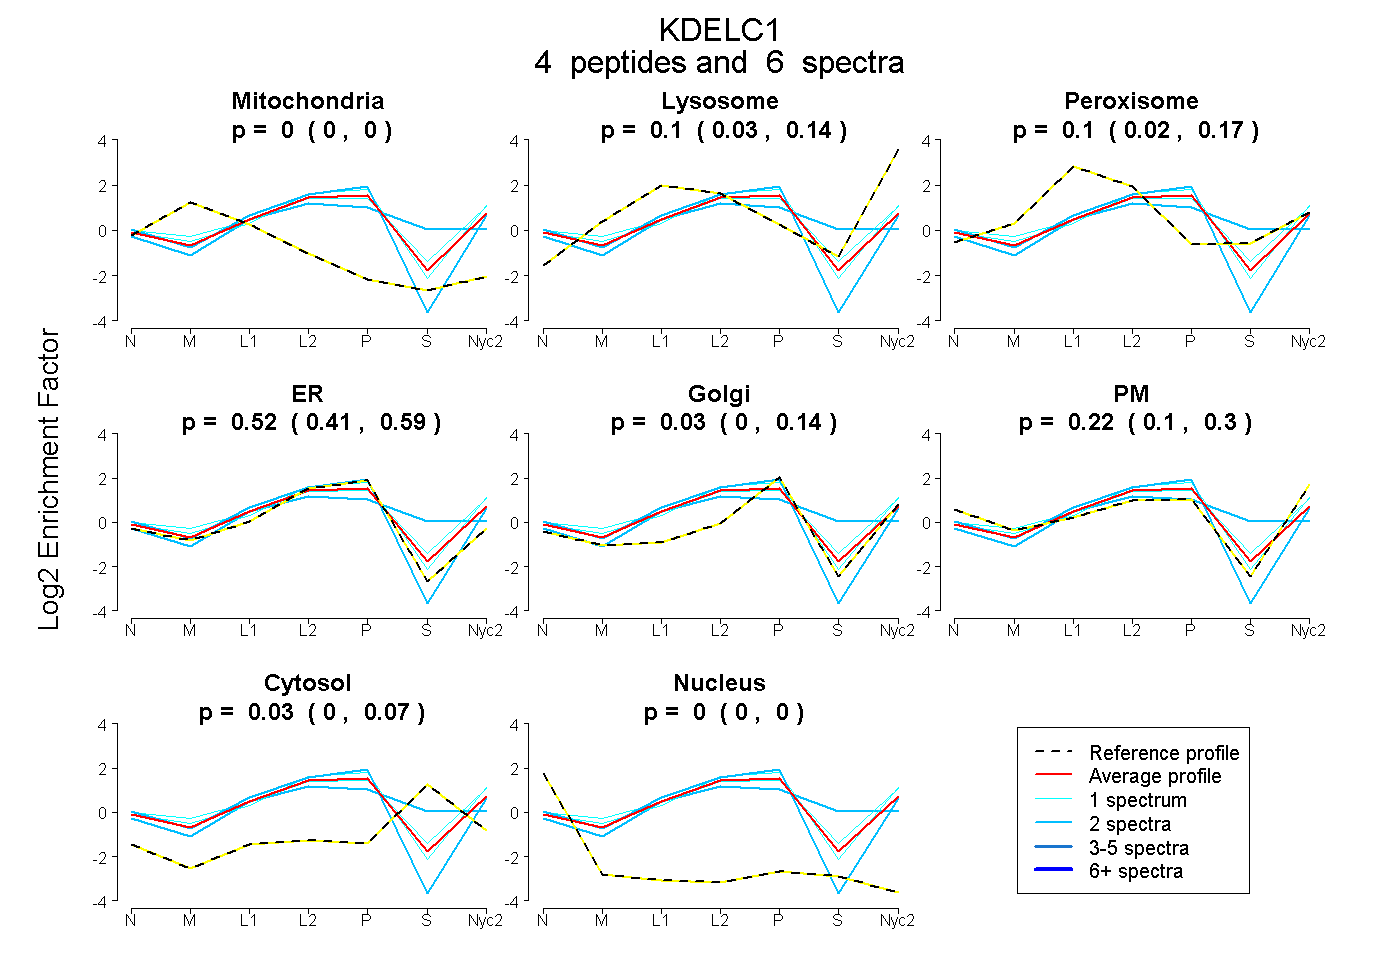
0.000 | 0.000
0.035 | 0.142
0.017 | 0.168
0.413 | 0.589
0.000 | 0.138
0.102 | 0.299
0.000 | 0.071
0.000 | 0.000
1peptide
spectrum
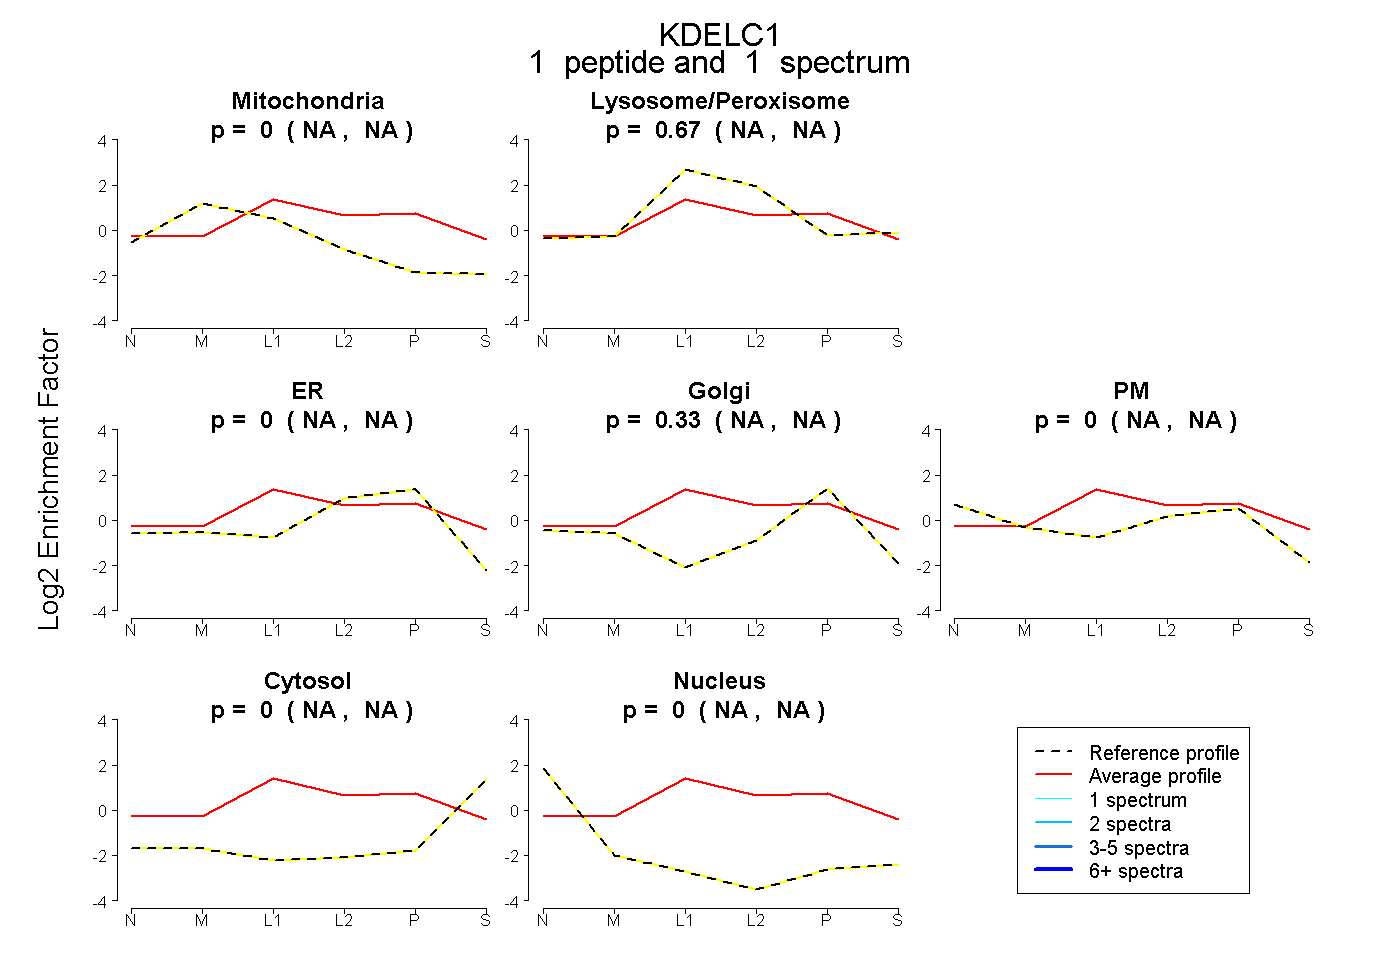
NA | NA
NA | NA
NA | NA
NA | NA
NA | NA
NA | NA
NA | NA
1peptide
spectra
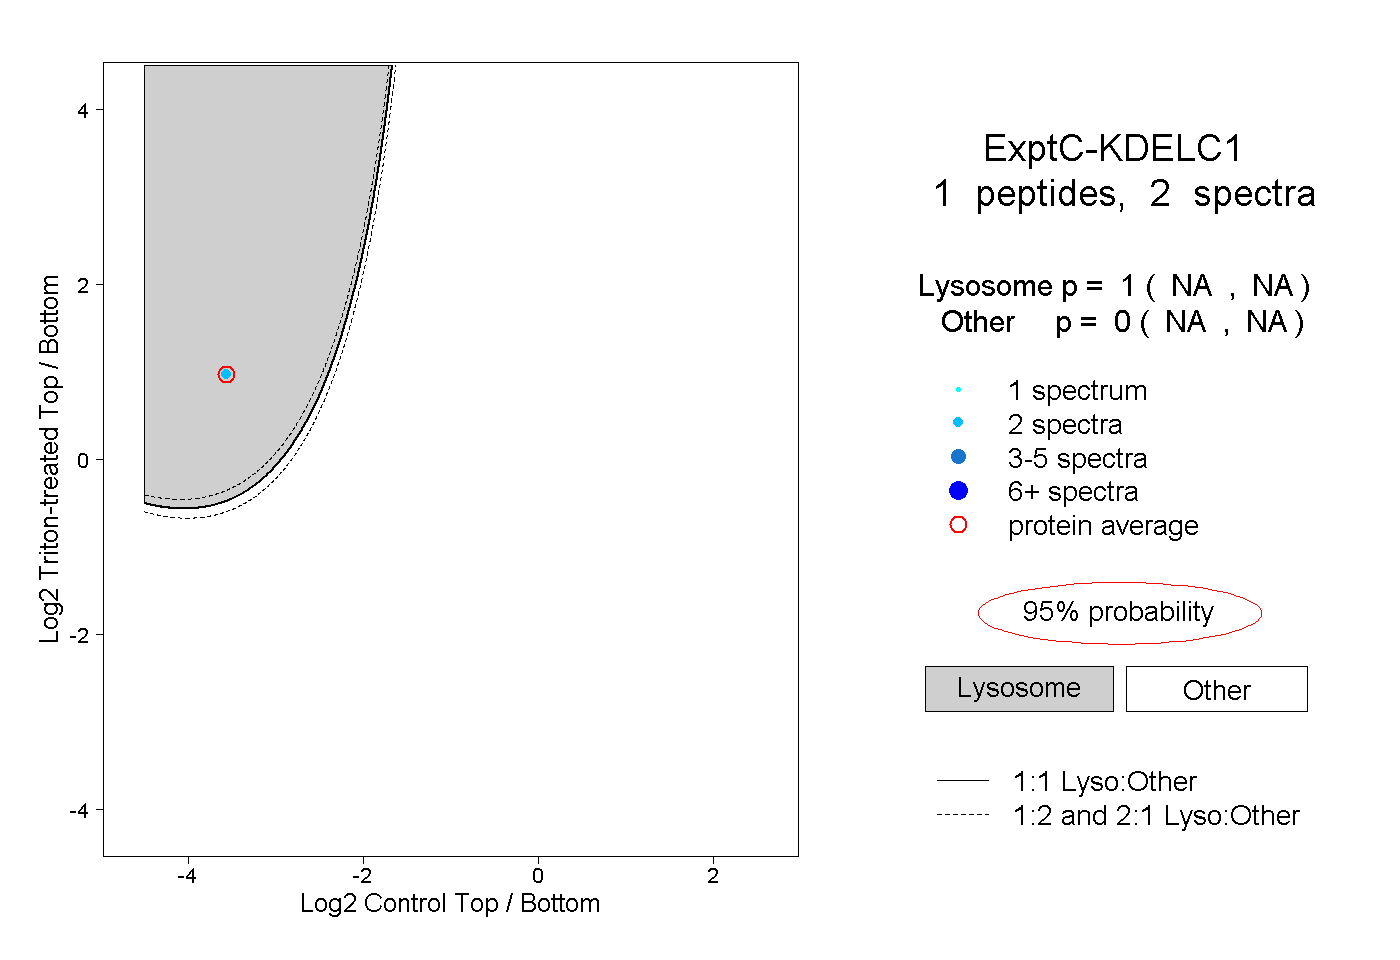
NA | NA
NA | NA