 4
4peptides
spectra
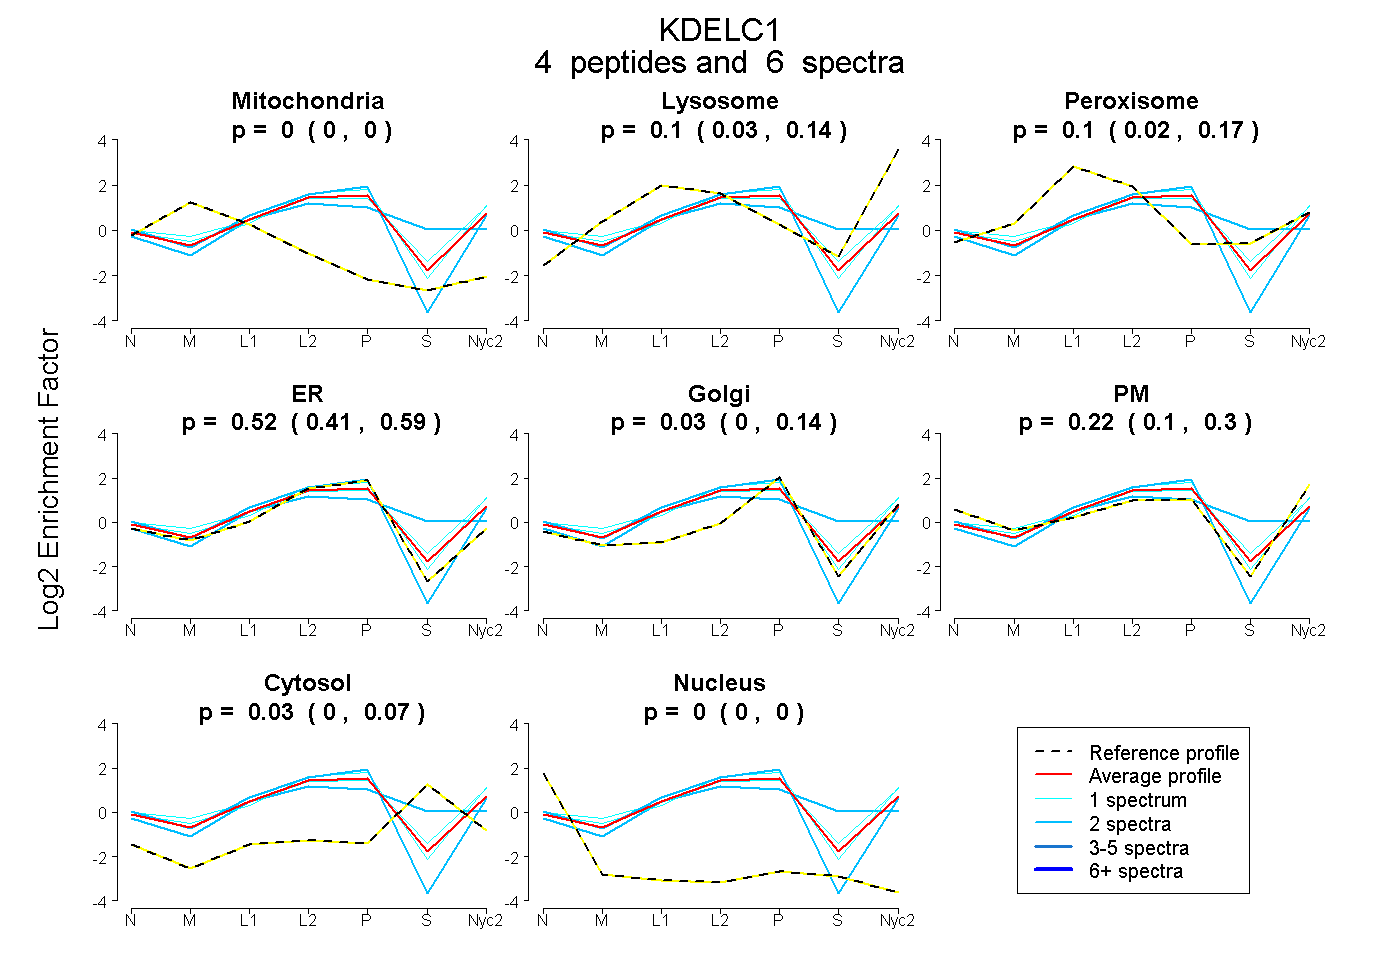
0.000 | 0.000
0.035 | 0.142
0.017 | 0.168
0.413 | 0.589
0.000 | 0.138
0.102 | 0.299
0.000 | 0.071
0.000 | 0.000
| Plot | Mito | Lyso | Perox | ER | Golgi | PM | Cytosol | Nucleus | |||||
| Expt A |
4 peptides |
6 spectra |
|
0.000 0.000 | 0.000 |
0.095 0.035 | 0.142 |
0.096 0.017 | 0.168 |
0.523 0.413 | 0.589 |
0.031 0.000 | 0.138 |
0.225 0.102 | 0.299 |
0.029 0.000 | 0.071 |
0.000 0.000 | 0.000 |
| 1 spectrum, DLSHFPTVDPEK | 0.000 | 0.163 | 0.000 | 0.540 | 0.000 | 0.297 | 0.000 | 0.000 | ||
| 2 spectra, AHVVLPAR | 0.000 | 0.018 | 0.291 | 0.413 | 0.000 | 0.000 | 0.278 | 0.000 | ||
| 2 spectra, SPYILR | 0.000 | 0.000 | 0.000 | 0.673 | 0.000 | 0.327 | 0.000 | 0.000 | ||
| 1 spectrum, SEIWGPGLK | 0.000 | 0.116 | 0.140 | 0.309 | 0.083 | 0.321 | 0.031 | 0.000 |
| Plot | Mito | Lyso or Perox | ER | Golgi | PM | Cytosol | Nucleus | ||||||
| Expt B |
1 peptide |
1 spectrum |
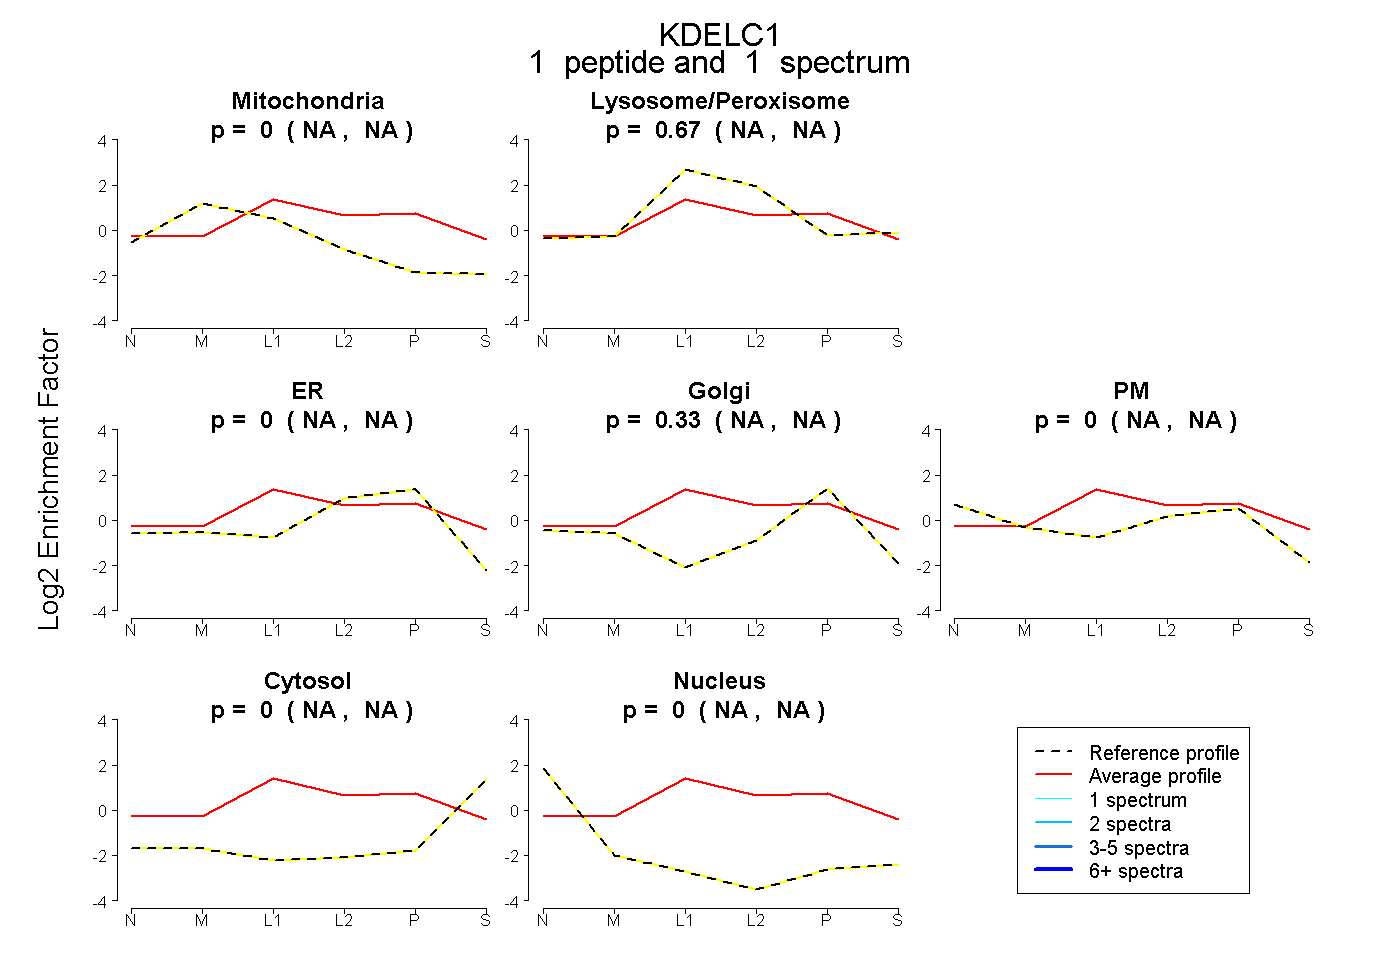 |
0.000 NA | NA |
0.672 NA | NA |
0.000 NA | NA |
0.328 NA | NA |
0.000 NA | NA |
0.000 NA | NA |
0.000 NA | NA |
|||
| Plot | Lyso | Other | |||||||||||
| Expt C |
1 peptide |
2 spectra |
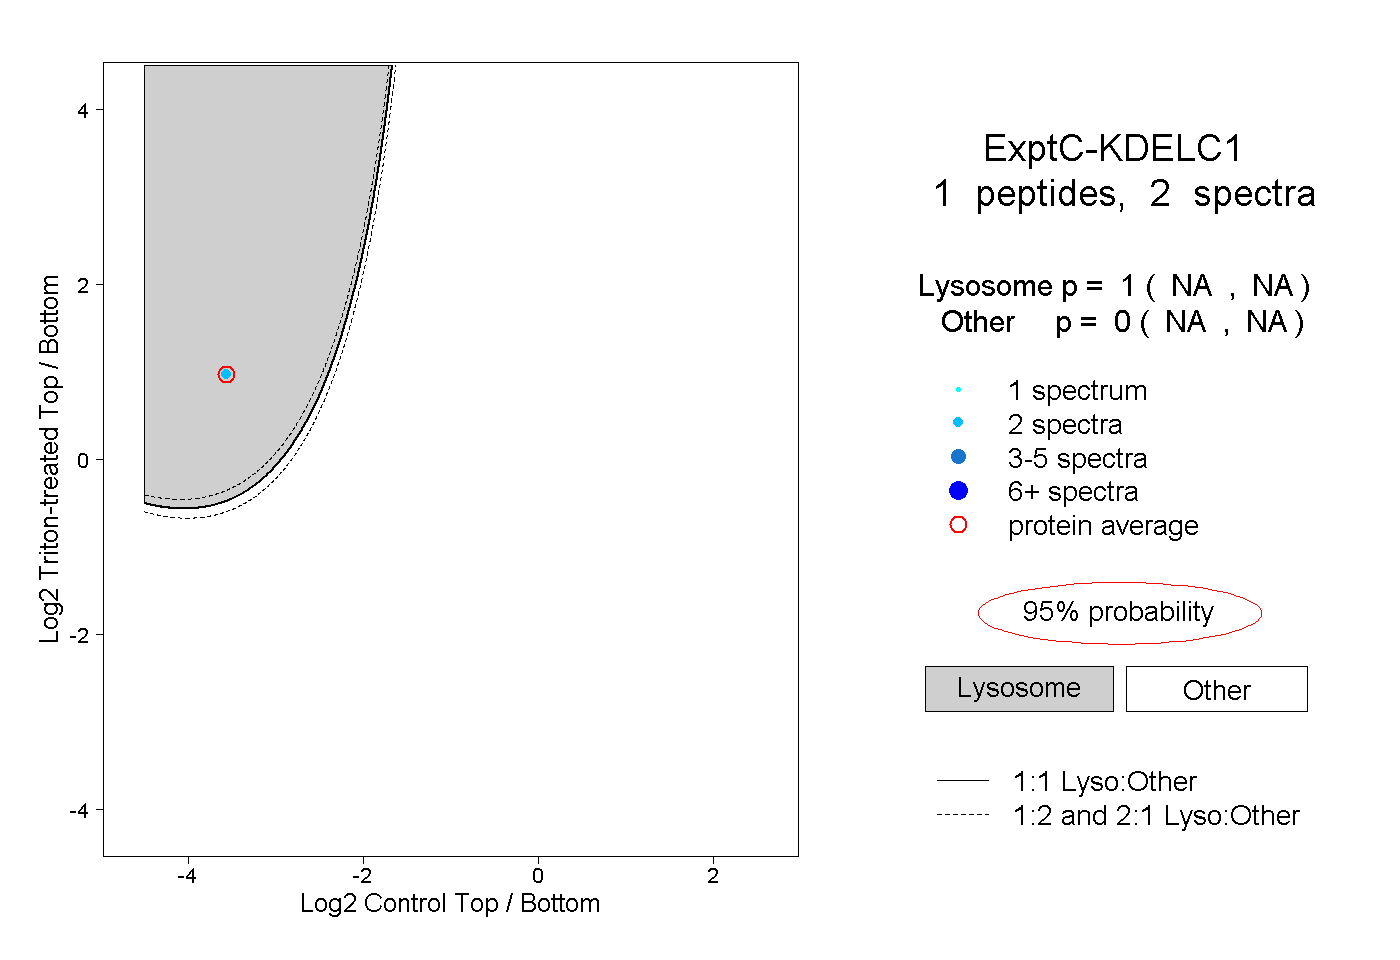 |
1.000 NA | NA |
0.000 NA | NA |