 7
7peptides
spectra
0.000 | 0.034
0.000 | 0.000
0.000 | 0.000
0.131 | 0.236
0.000 | 0.099
0.000 | 0.000
0.707 | 0.755
0.000 | 0.045
1peptide
spectrum
NA | NA
NA | NA
NA | NA
NA | NA
NA | NA
NA | NA
NA | NA
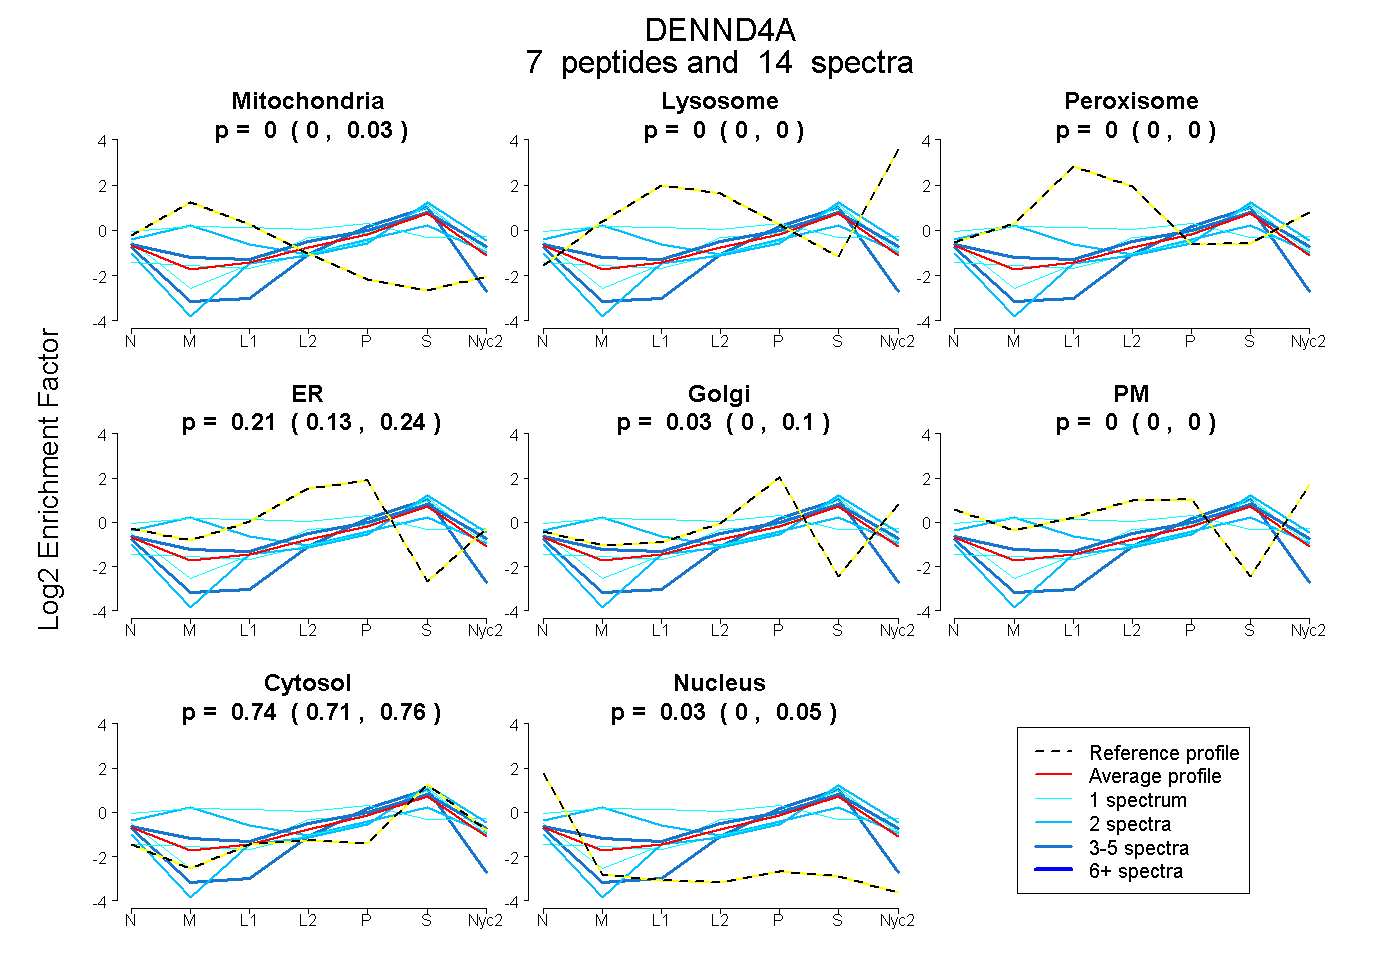
| Plot | Mito | Lyso | Perox | ER | Golgi | PM | Cytosol | Nucleus | |||||
| Expt A |
7 peptides |
14 spectra |
|
0.000 0.000 | 0.034 |
0.000 0.000 | 0.000 |
0.000 0.000 | 0.000 |
0.207 0.131 | 0.236 |
0.029 0.000 | 0.099 |
0.000 0.000 | 0.000 |
0.736 0.707 | 0.755 |
0.028 0.000 | 0.045 |
||
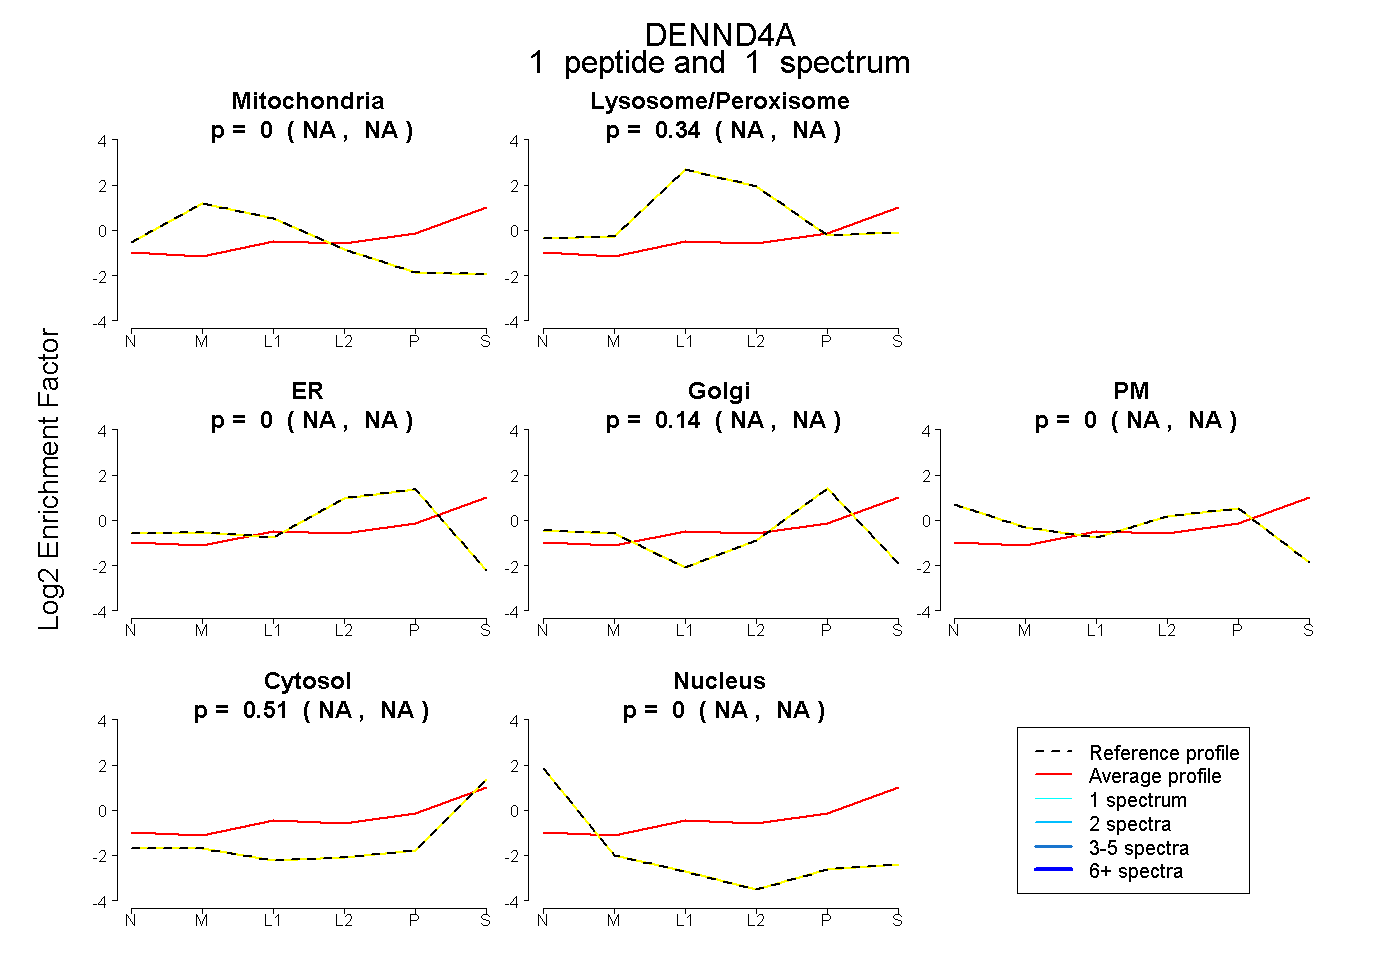
| Plot | Mito | Lyso or Perox | ER | Golgi | PM | Cytosol | Nucleus | ||||||
| Expt B |
1 peptide |
1 spectrum |
|
0.000 NA | NA |
0.345 NA | NA |
0.000 NA | NA |
0.143 NA | NA |
0.000 NA | NA |
0.513 NA | NA |
0.000 NA | NA |