 3
3peptides
spectra
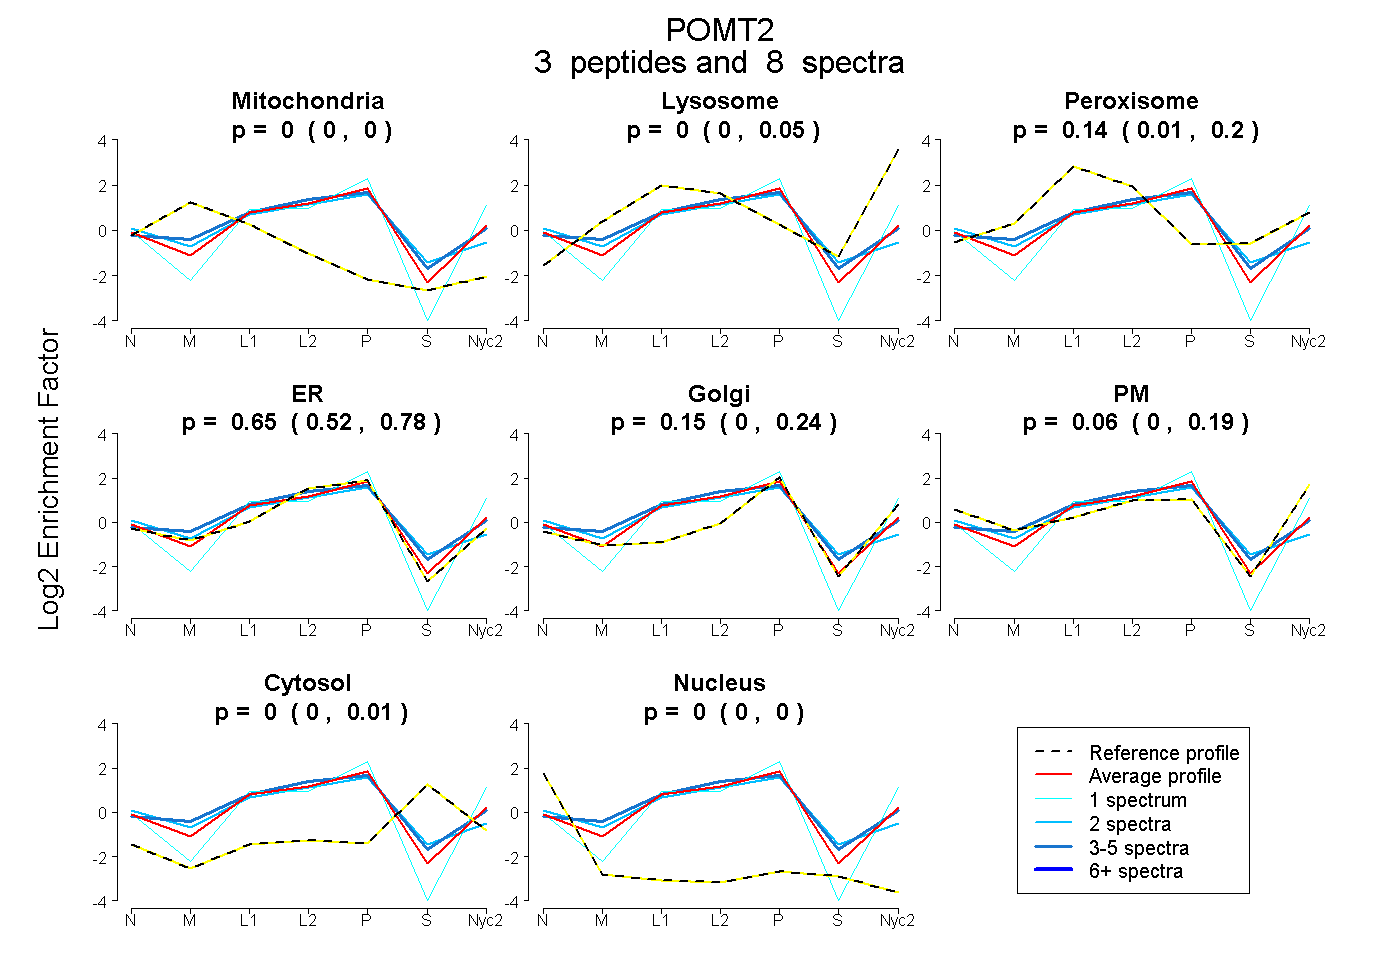
0.000 | 0.000
0.000 | 0.047
0.013 | 0.203
0.516 | 0.782
0.000 | 0.239
0.000 | 0.191
0.000 | 0.012
0.000 | 0.002
1peptide
spectra
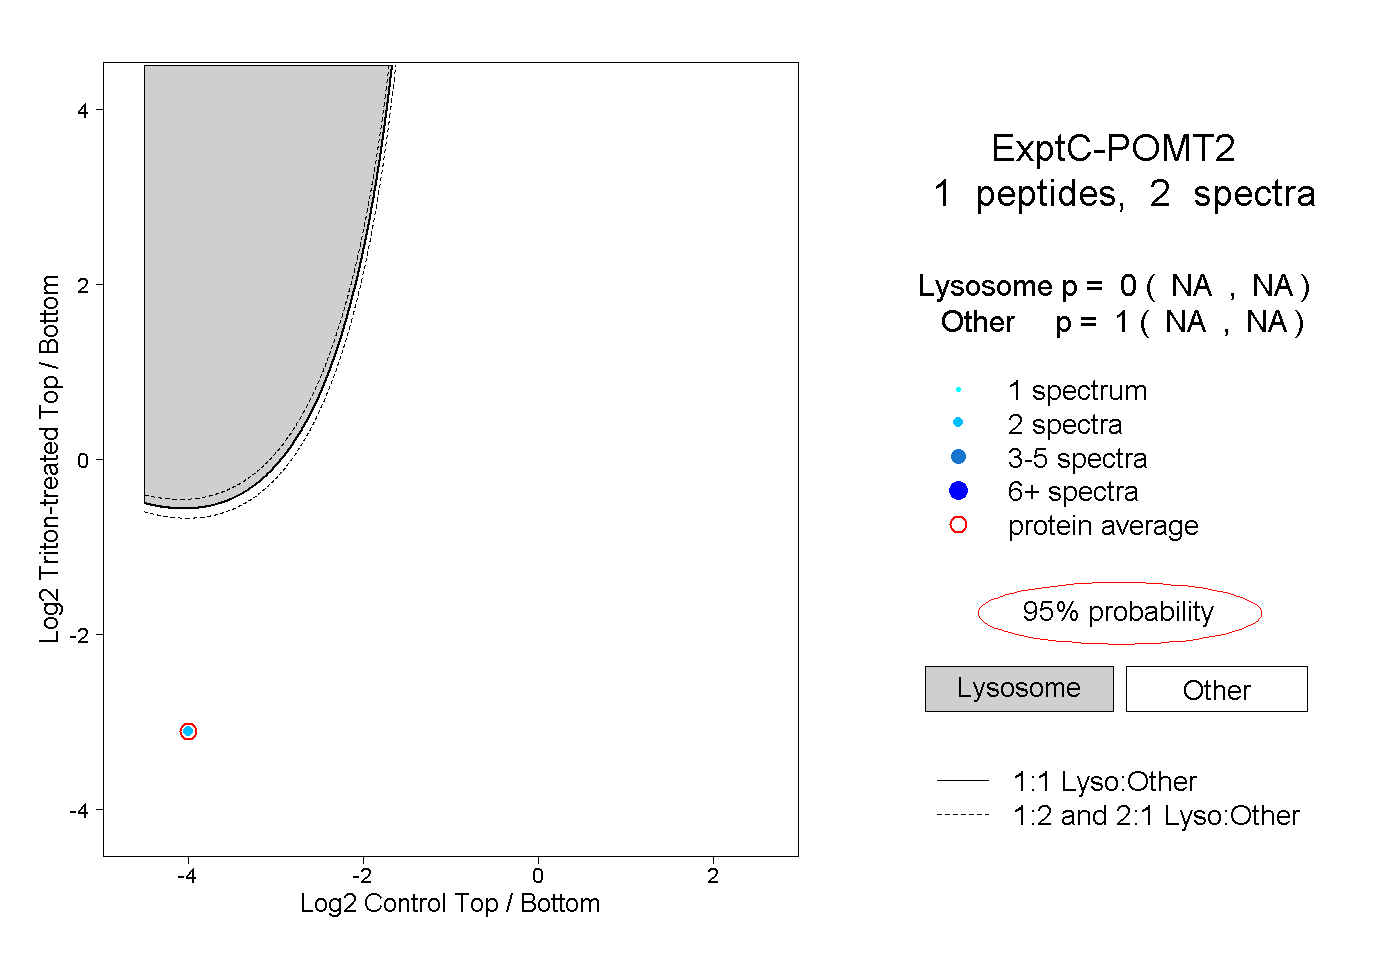
NA | NA
NA | NA
1peptide
spectra
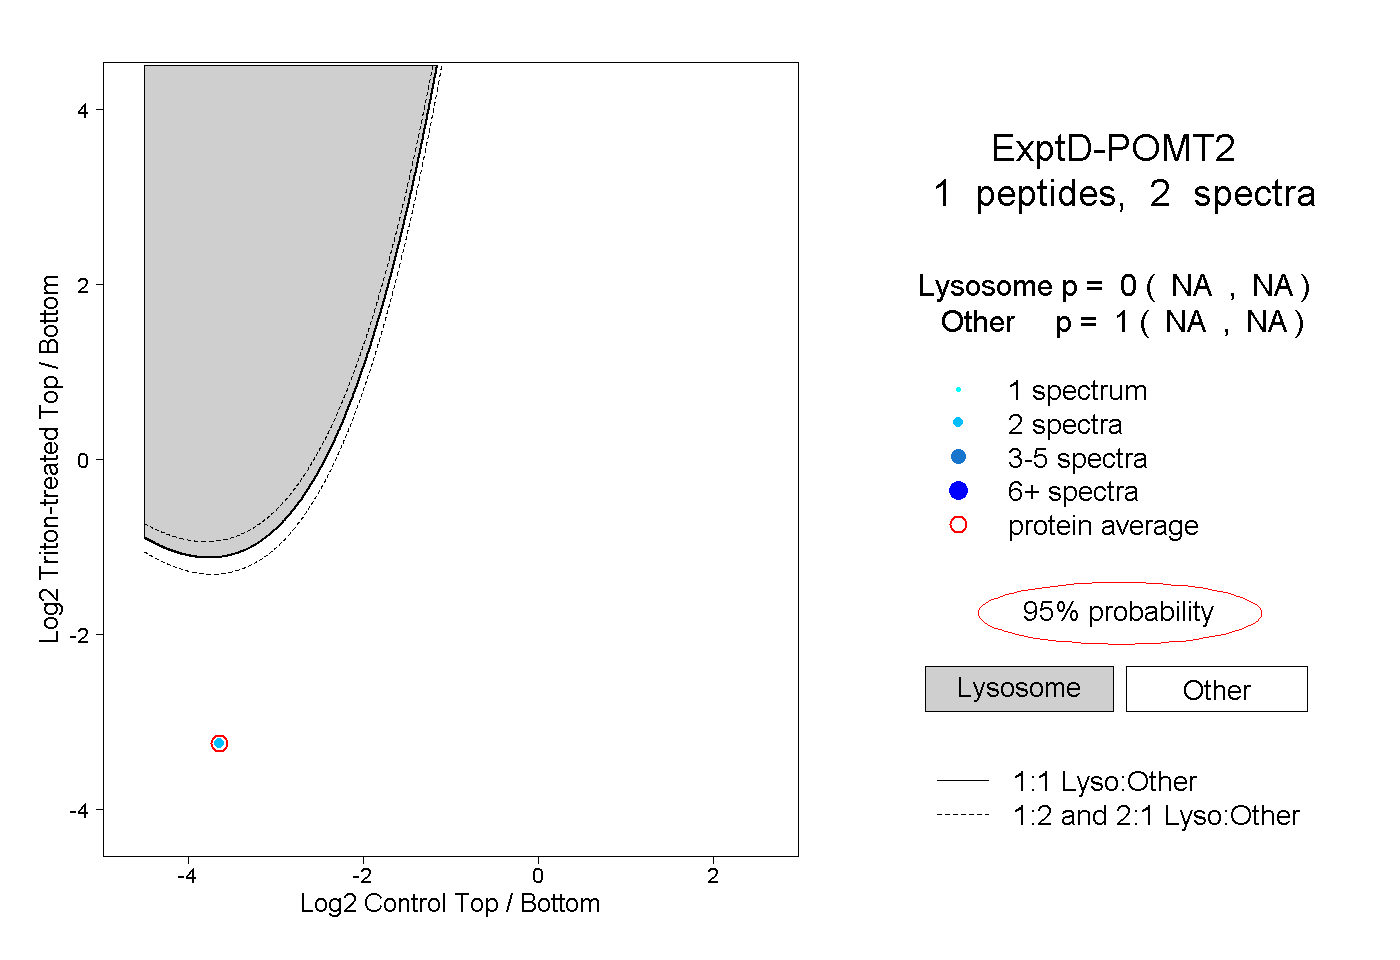
NA | NA
NA | NA