 3
3peptides
spectra
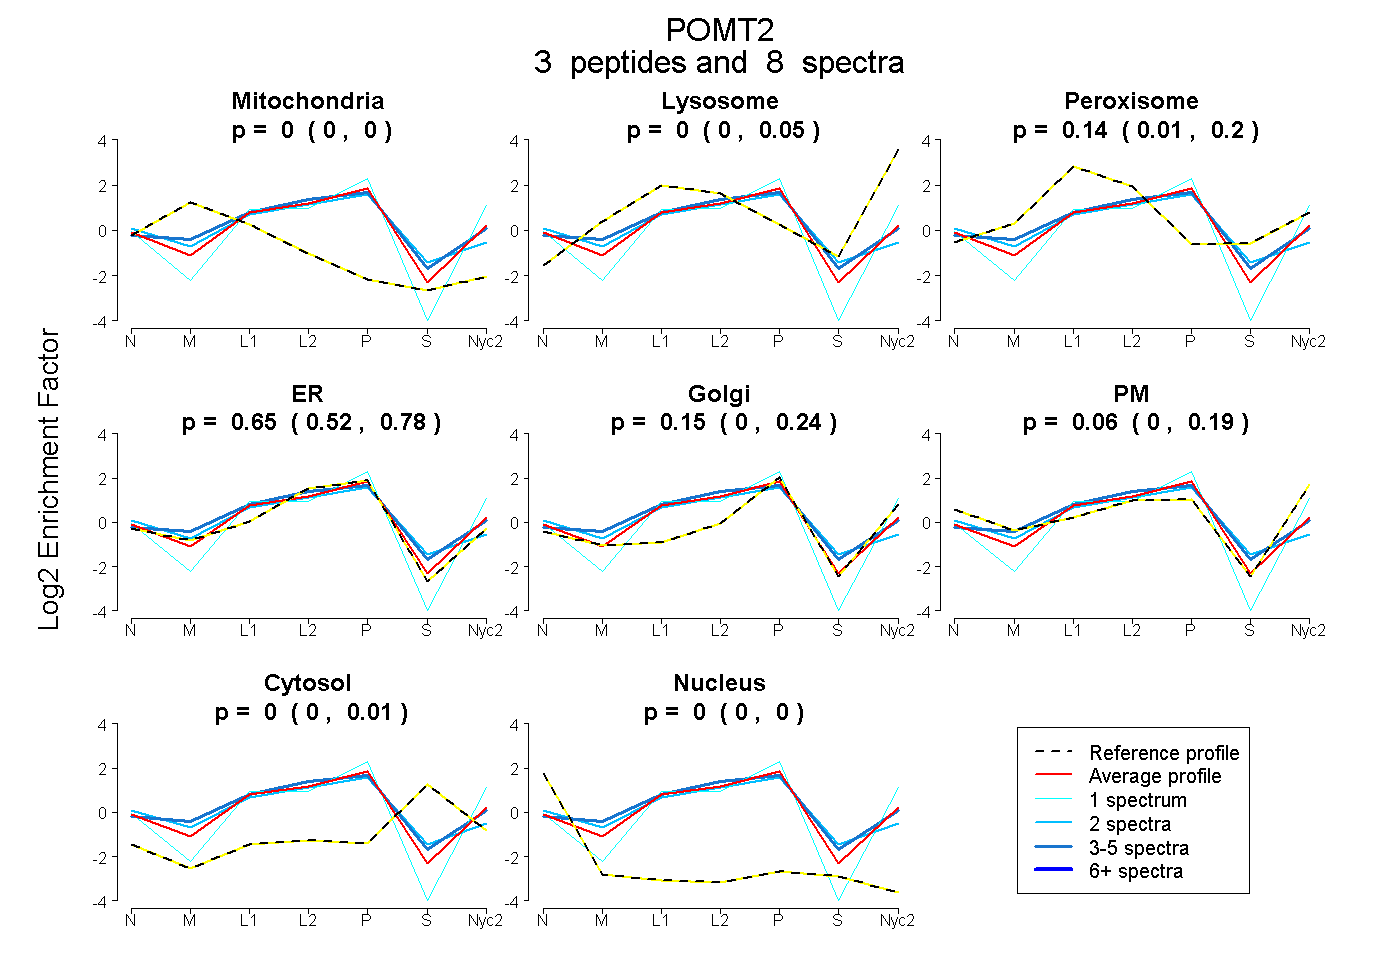
0.000 | 0.000
0.000 | 0.047
0.013 | 0.203
0.516 | 0.782
0.000 | 0.239
0.000 | 0.191
0.000 | 0.012
0.000 | 0.002
| Plot | Mito | Lyso | Perox | ER | Golgi | PM | Cytosol | Nucleus | |||||
| Expt A |
3 peptides |
8 spectra |
|
0.000 0.000 | 0.000 |
0.000 0.000 | 0.047 |
0.141 0.013 | 0.203 |
0.654 0.516 | 0.782 |
0.146 0.000 | 0.239 |
0.059 0.000 | 0.191 |
0.000 0.000 | 0.012 |
0.000 0.000 | 0.002 |
| 1 spectrum, SVQQAAR | 0.000 | 0.000 | 0.000 | 0.527 | 0.197 | 0.277 | 0.000 | 0.000 | ||
| 2 spectra, DVVPEAATR | 0.000 | 0.000 | 0.188 | 0.715 | 0.000 | 0.000 | 0.090 | 0.006 | ||
| 5 spectra, RPAWSSR | 0.000 | 0.000 | 0.273 | 0.588 | 0.139 | 0.000 | 0.000 | 0.000 |
| Plot | Lyso | Other | |||||||||||
| Expt C |
1 peptide |
2 spectra |
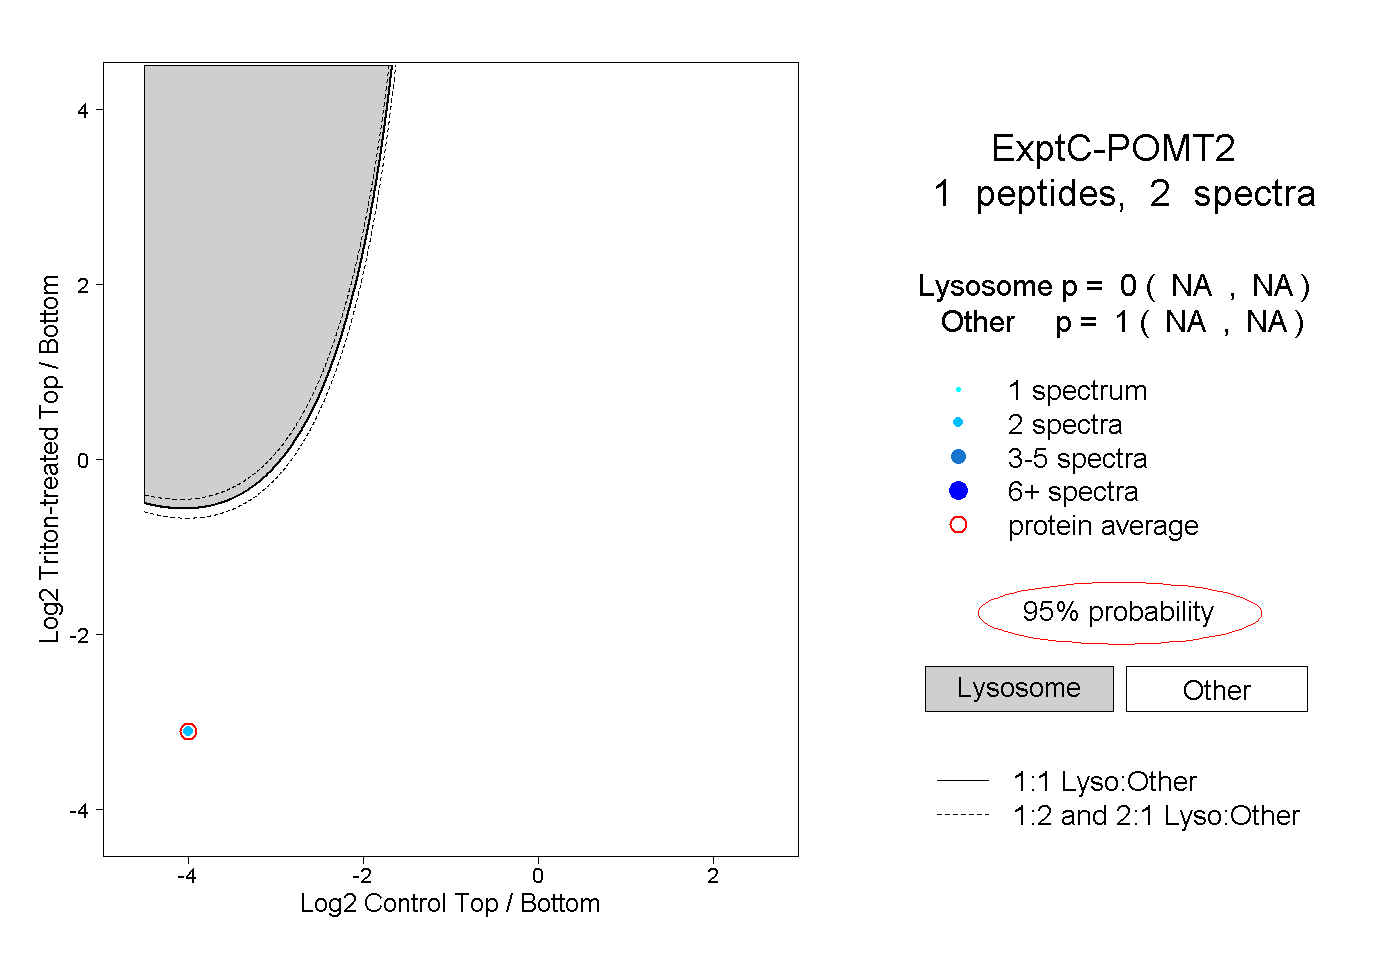 |
0.000 NA | NA |
1.000 NA | NA |
||||||||
| Plot | Lyso | Other | |||||||||||
| Expt D |
1 peptide |
2 spectra |
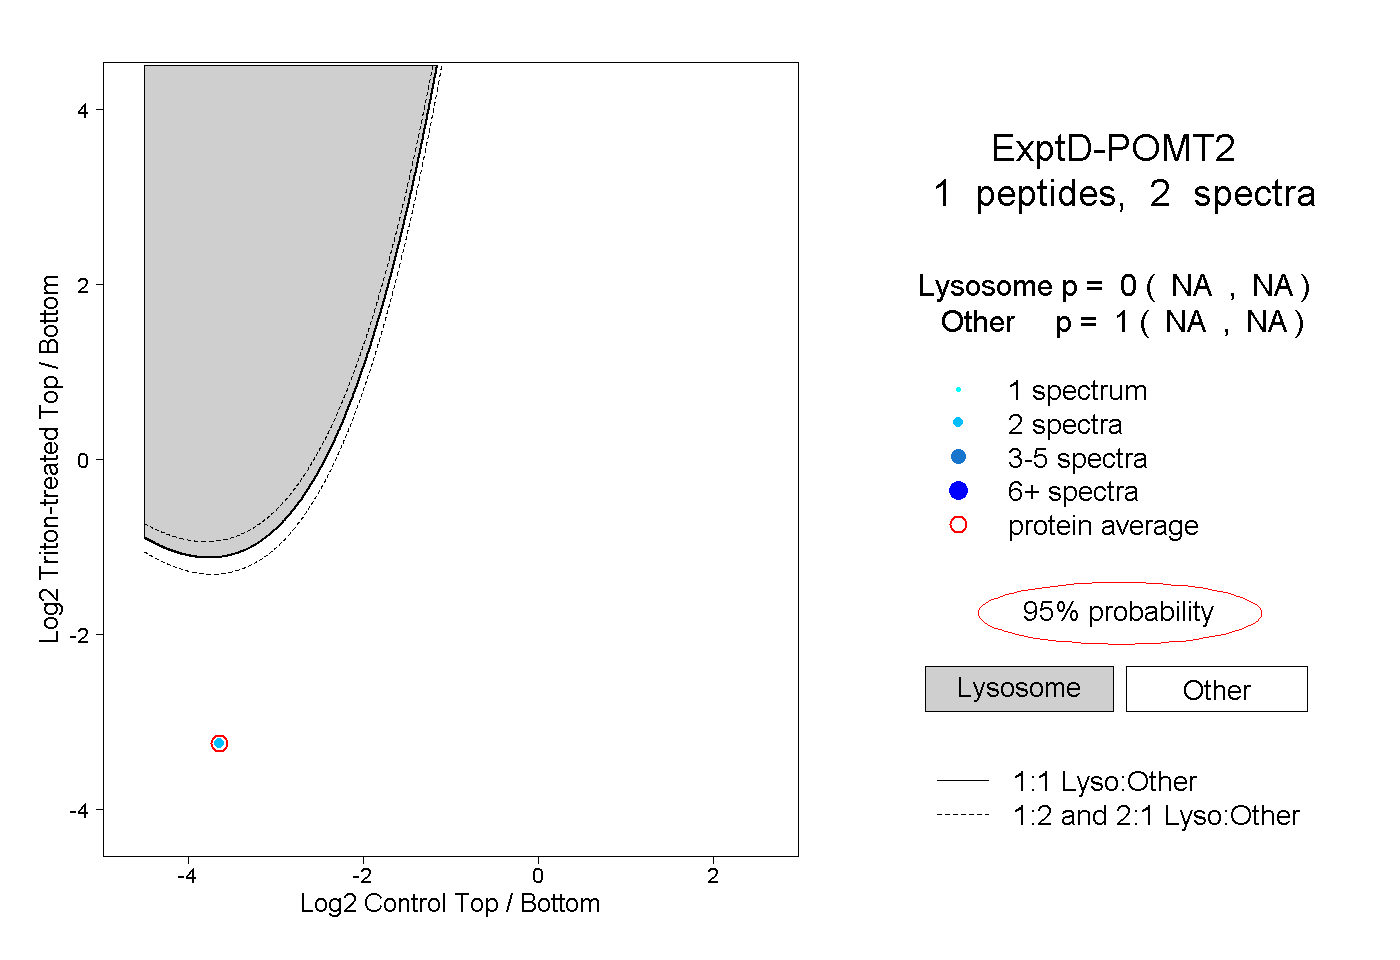 |
0.000 NA | NA |
1.000 NA | NA |