 2
2peptides
spectra
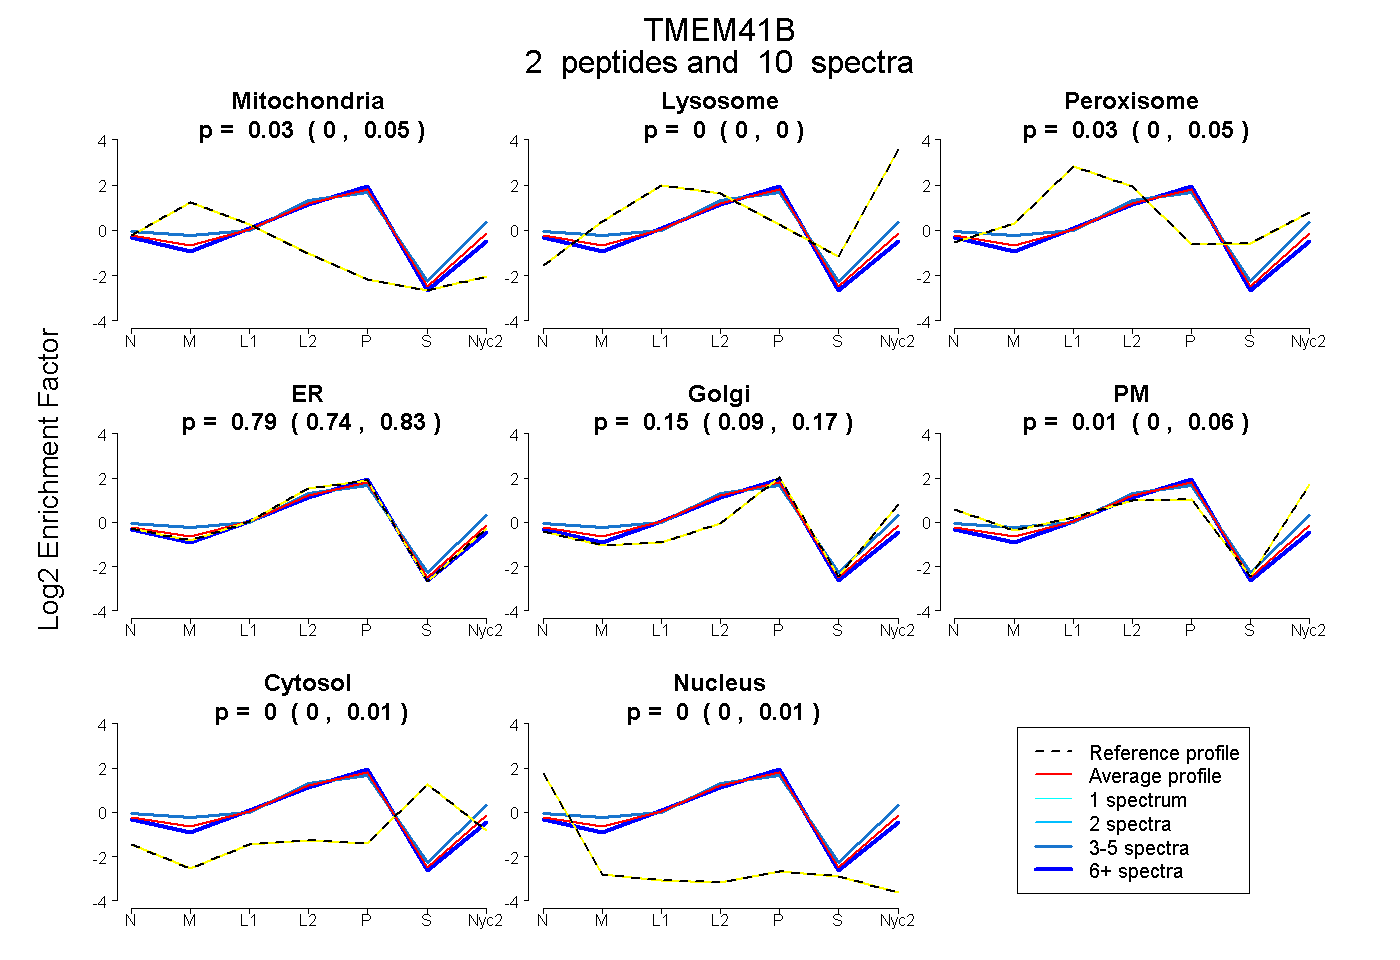
0.001 | 0.046
0.000 | 0.003
0.000 | 0.055
0.740 | 0.829
0.089 | 0.173
0.000 | 0.058
0.000 | 0.015
0.000 | 0.006
1peptide
spectrum
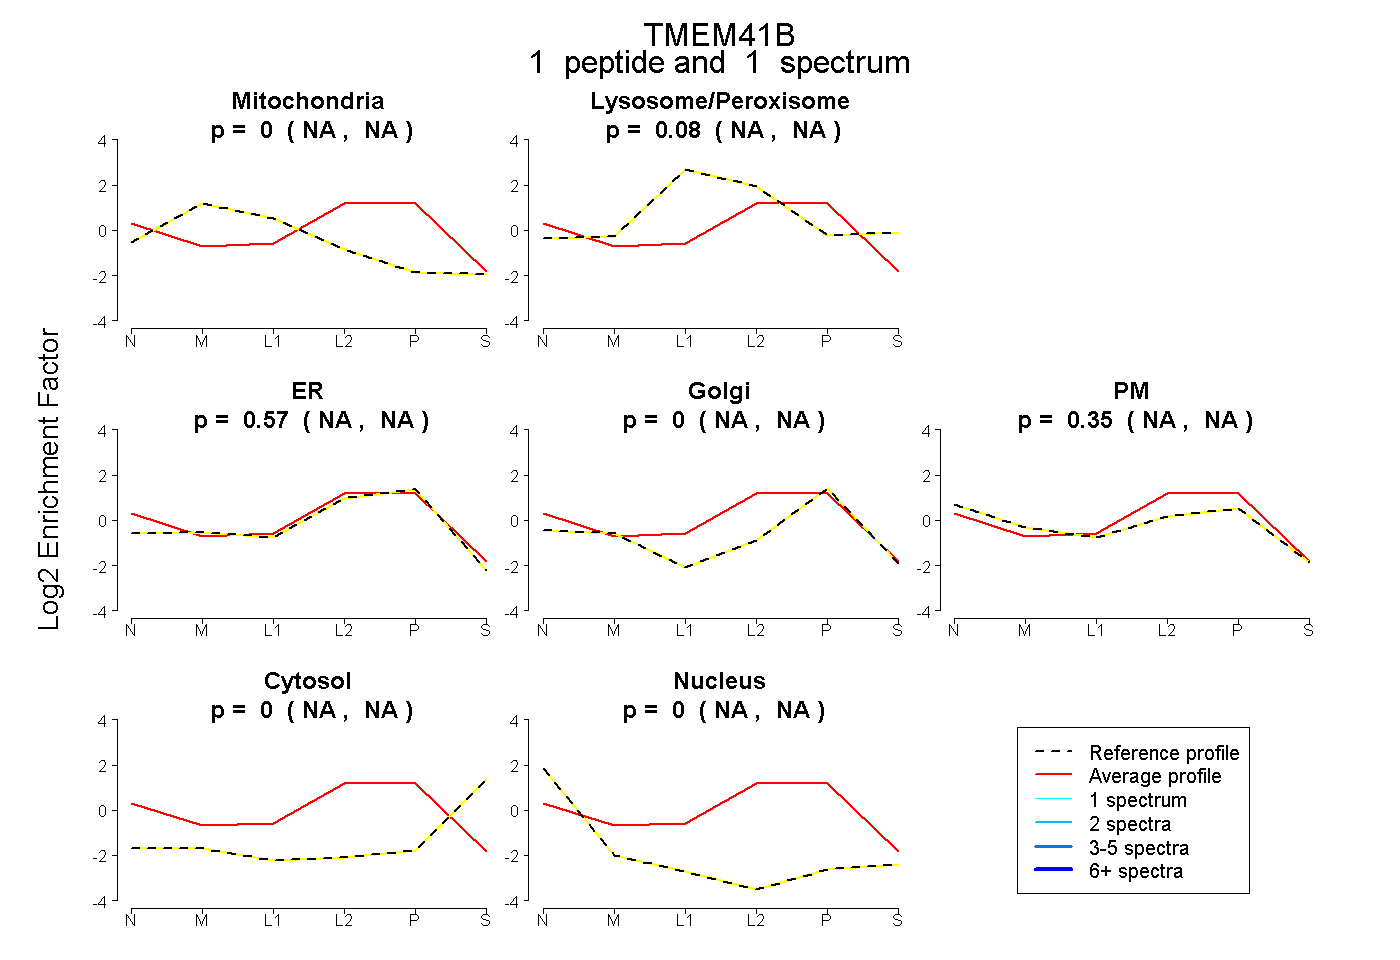
NA | NA
NA | NA
NA | NA
NA | NA
NA | NA
NA | NA
NA | NA
4peptides
spectra
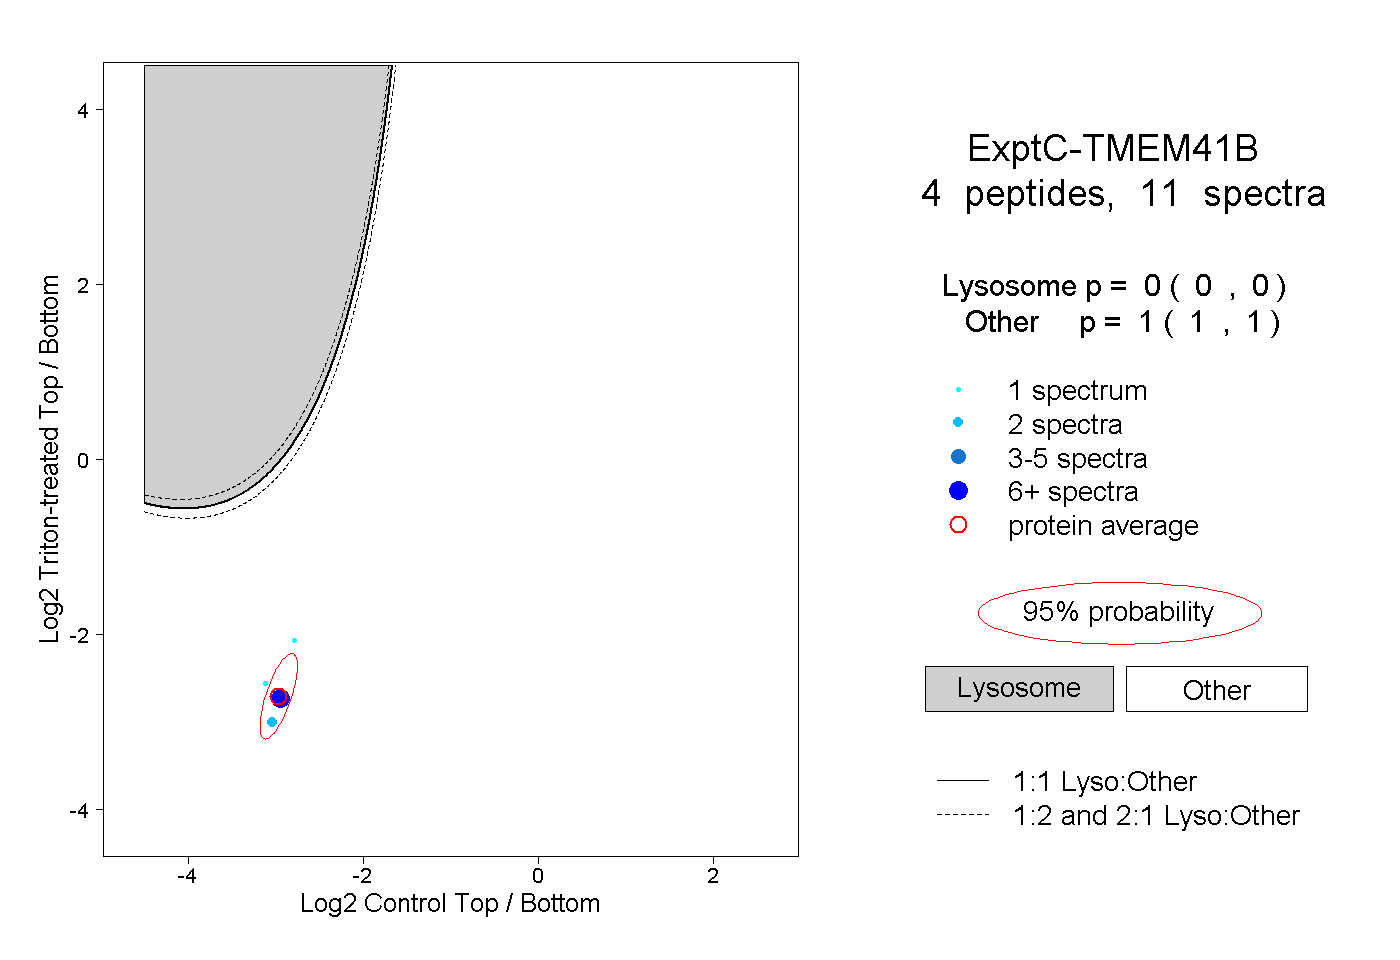
0.000 | 0.000
1.000 | 1.000