 2
2peptides
spectra
0.001 | 0.046
0.000 | 0.003
0.000 | 0.055
0.740 | 0.829
0.089 | 0.173
0.000 | 0.058
0.000 | 0.015
0.000 | 0.006
| Plot | Mito | Lyso | Perox | ER | Golgi | PM | Cytosol | Nucleus | |||||
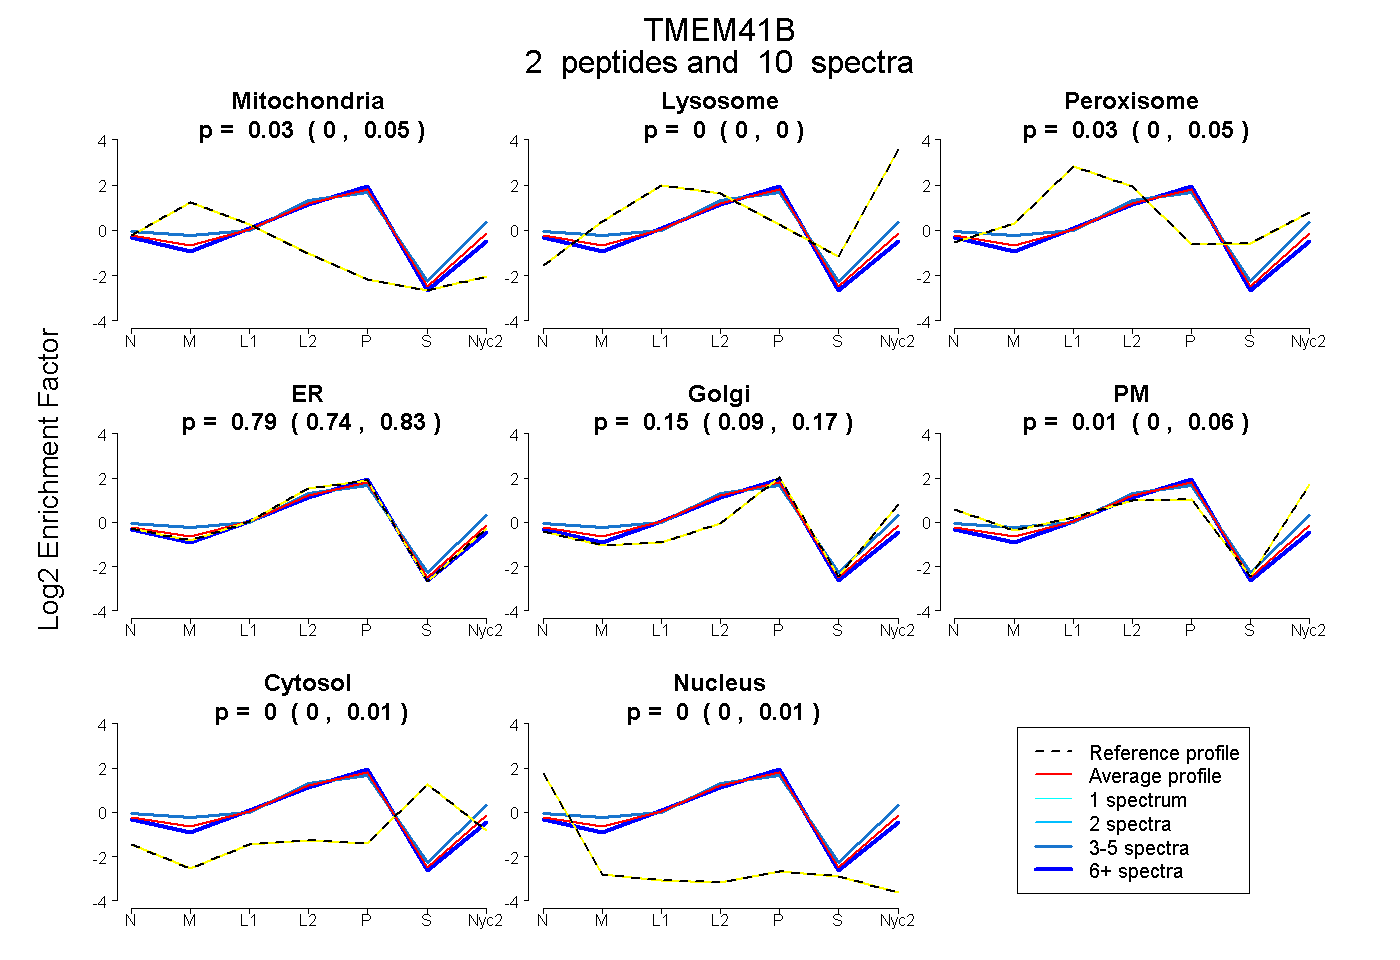
| Expt A |
2 peptides |
10 spectra |
|
0.029 0.001 | 0.046 |
0.000 0.000 | 0.003 |
0.030 0.000 | 0.055 |
0.788 0.740 | 0.829 |
0.146 0.089 | 0.173 |
0.007 0.000 | 0.058 |
0.000 0.000 | 0.015 |
0.000 0.000 | 0.006 |
| 6 spectra, DMDDAK | 0.004 | 0.000 | 0.000 | 0.910 | 0.056 | 0.000 | 0.001 | 0.029 | ||
| 4 spectra, NFPQLSEEER | 0.026 | 0.031 | 0.020 | 0.617 | 0.068 | 0.238 | 0.000 | 0.000 |
| Plot | Mito | Lyso or Perox | ER | Golgi | PM | Cytosol | Nucleus | ||||||
| Expt B |
1 peptide |
1 spectrum |
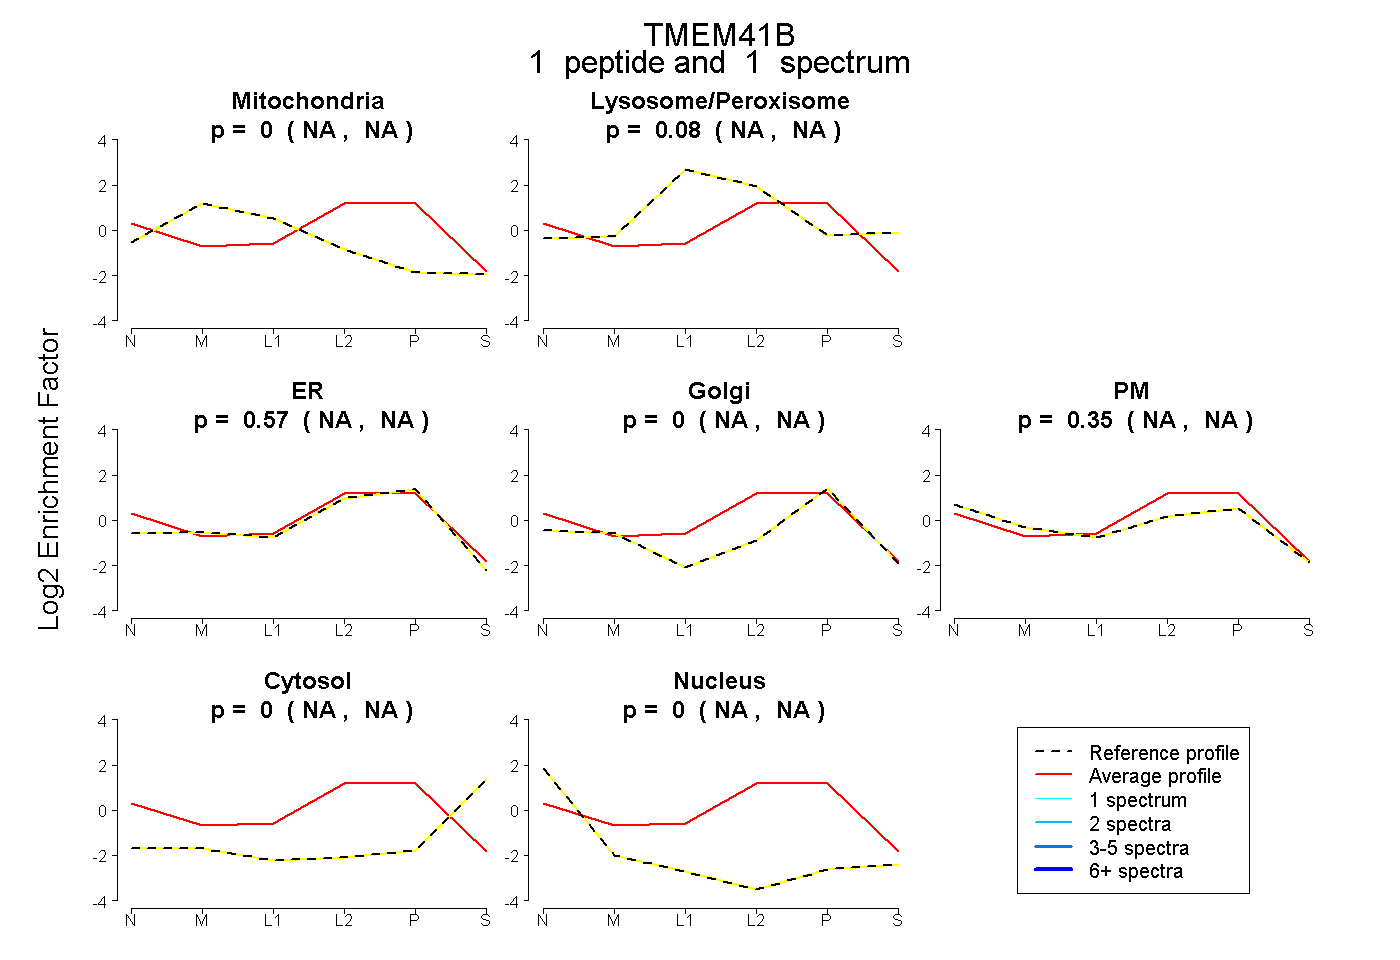 |
0.000 NA | NA |
0.080 NA | NA |
0.574 NA | NA |
0.000 NA | NA |
0.347 NA | NA |
0.000 NA | NA |
0.000 NA | NA |
|||
| Plot | Lyso | Other | |||||||||||
| Expt C |
4 peptides |
11 spectra |
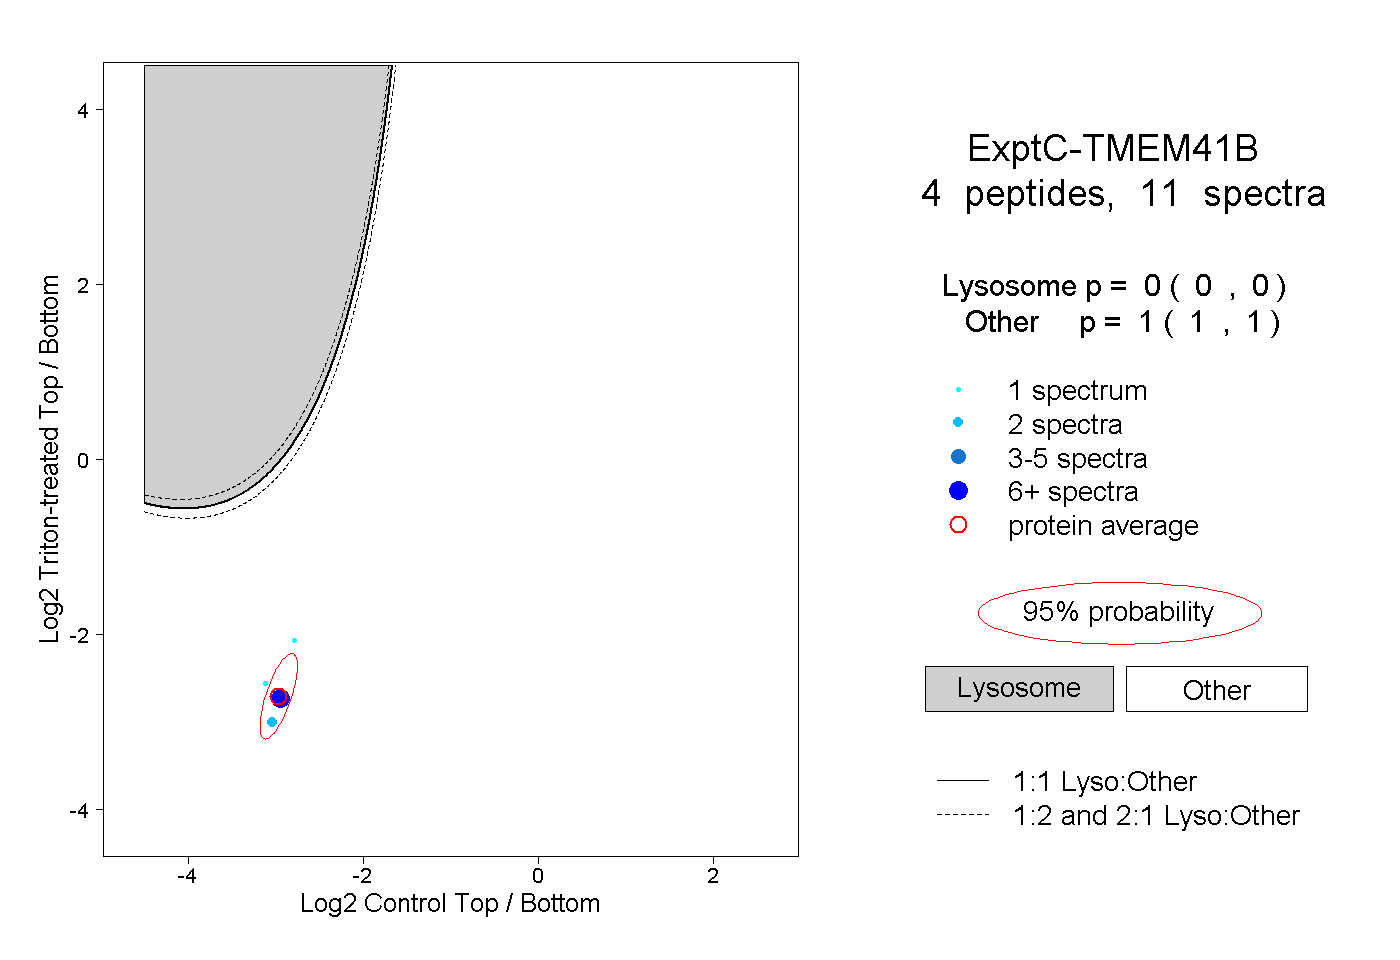 |
0.000 0.000 | 0.000 |
1.000 1.000 | 1.000 |