 7
7peptides
spectra
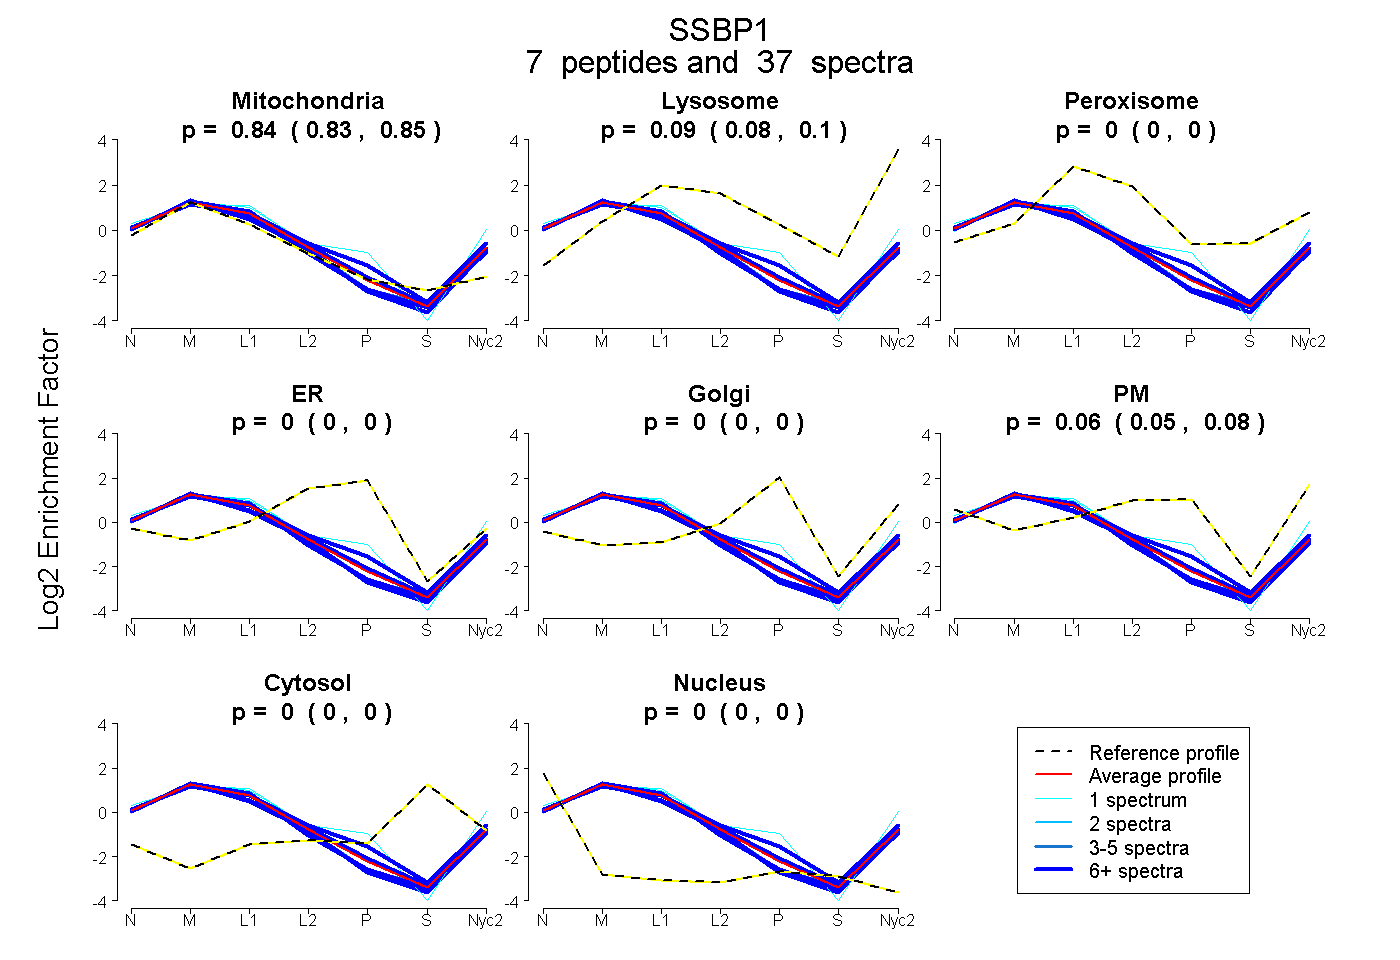
0.833 | 0.850
0.085 | 0.100
0.000 | 0.000
0.000 | 0.000
0.000 | 0.000
0.050 | 0.077
0.000 | 0.000
0.000 | 0.000
2peptides
spectra
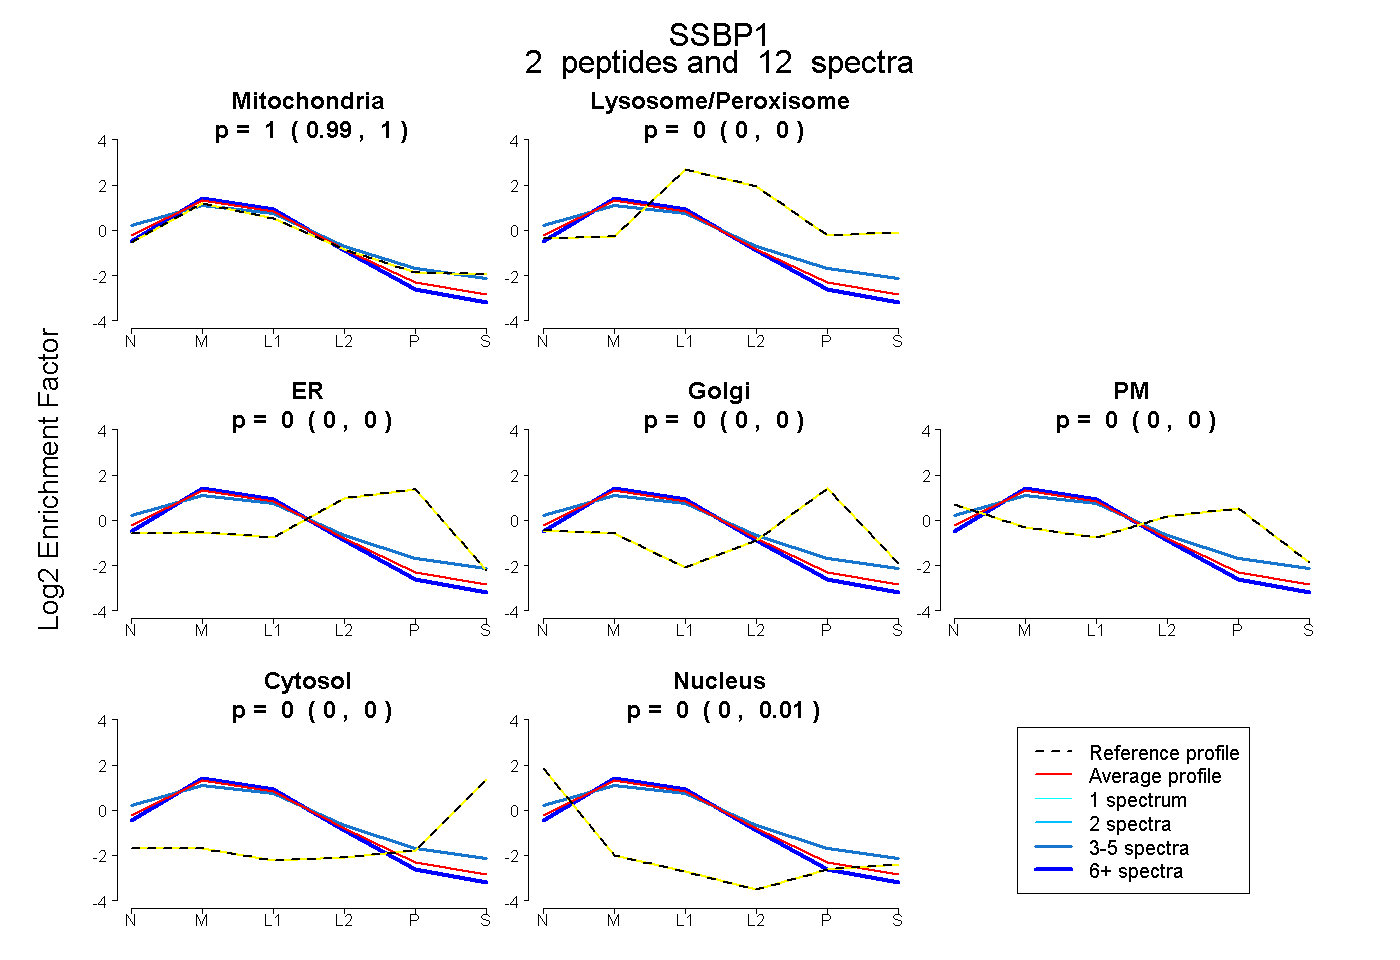
0.993 | 1.000
0.000 | 0.000
0.000 | 0.000
0.000 | 0.000
0.000 | 0.000
0.000 | 0.000
0.000 | 0.006
7peptides
spectra
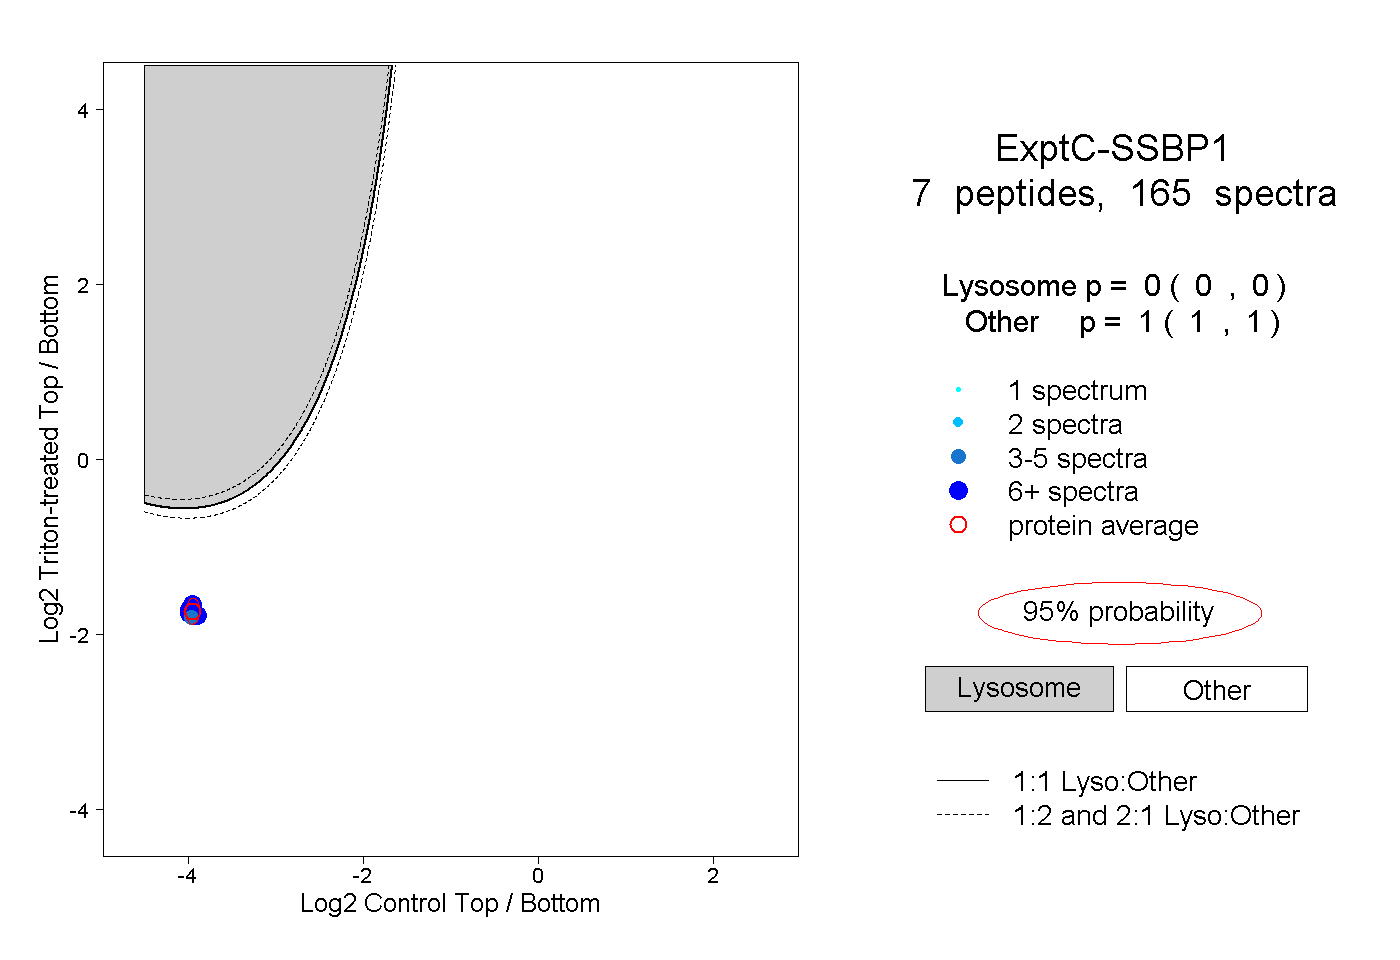
0.000 | 0.000
1.000 | 1.000
6peptides
spectra
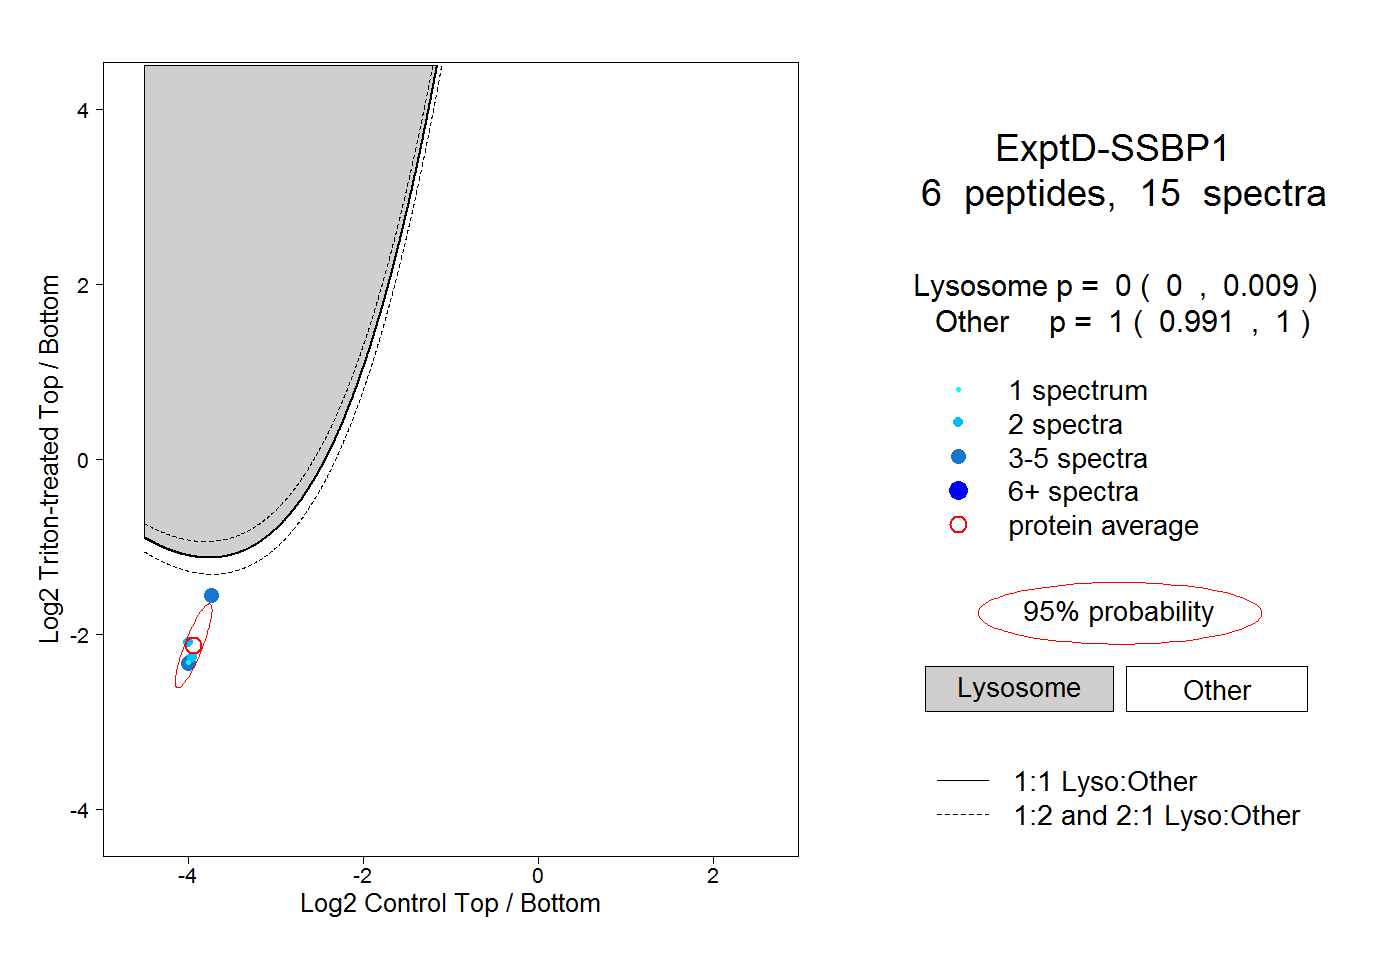
0.000 | 0.009
0.991 | 1.000