 7
7peptides
spectra
0.833 | 0.850
0.085 | 0.100
0.000 | 0.000
0.000 | 0.000
0.000 | 0.000
0.050 | 0.077
0.000 | 0.000
0.000 | 0.000
| Plot | Mito | Lyso | Perox | ER | Golgi | PM | Cytosol | Nucleus | |||||
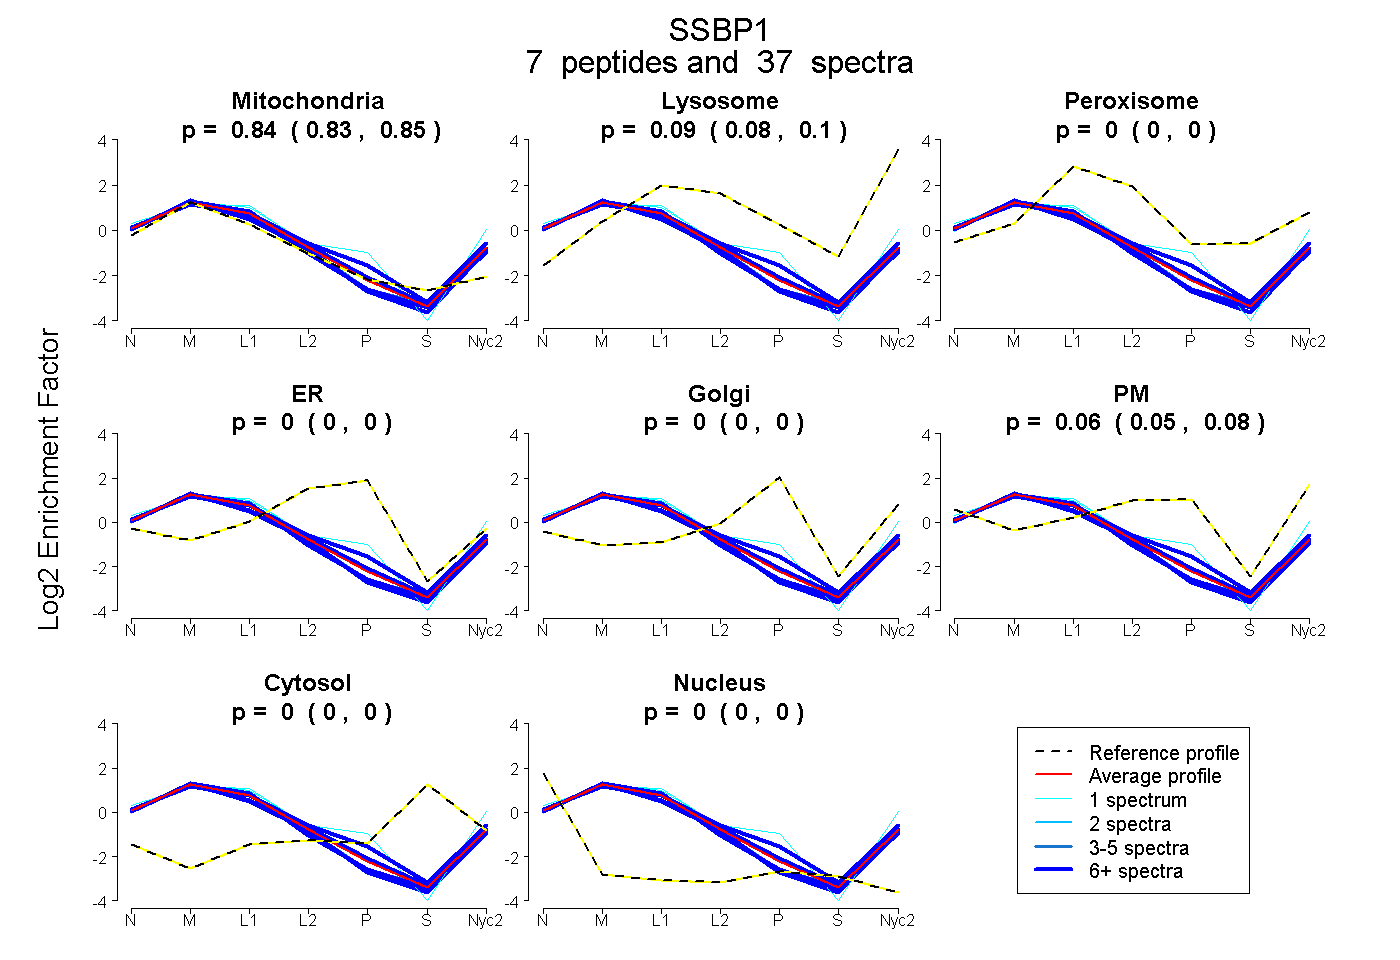
| Expt A |
7 peptides |
37 spectra |
|
0.842 0.833 | 0.850 |
0.093 0.085 | 0.100 |
0.000 0.000 | 0.000 |
0.000 0.000 | 0.000 |
0.000 0.000 | 0.000 |
0.064 0.050 | 0.077 |
0.000 0.000 | 0.000 |
0.000 0.000 | 0.000 |
| 1 spectrum, DVAYQYVK | 0.868 | 0.059 | 0.073 | 0.000 | 0.000 | 0.000 | 0.000 | 0.000 | ||
| 6 spectra, ISVFRPGLR | 0.918 | 0.065 | 0.000 | 0.000 | 0.000 | 0.017 | 0.000 | 0.000 | ||
| 12 spectra, VDYGEYMDK | 0.898 | 0.102 | 0.000 | 0.000 | 0.000 | 0.000 | 0.000 | 0.000 | ||
| 1 spectrum, SGDNEAYQMGDVSQK | 0.620 | 0.088 | 0.000 | 0.000 | 0.000 | 0.292 | 0.000 | 0.000 | ||
| 6 spectra, VGQDPVMR | 0.843 | 0.054 | 0.000 | 0.000 | 0.000 | 0.104 | 0.000 | 0.000 | ||
| 8 spectra, VQLLGR | 0.732 | 0.065 | 0.000 | 0.000 | 0.000 | 0.203 | 0.000 | 0.000 | ||
| 3 spectra, IFVEGK | 0.864 | 0.136 | 0.000 | 0.000 | 0.000 | 0.000 | 0.000 | 0.000 |
| Plot | Mito | Lyso or Perox | ER | Golgi | PM | Cytosol | Nucleus | ||||||
| Expt B |
2 peptides |
12 spectra |
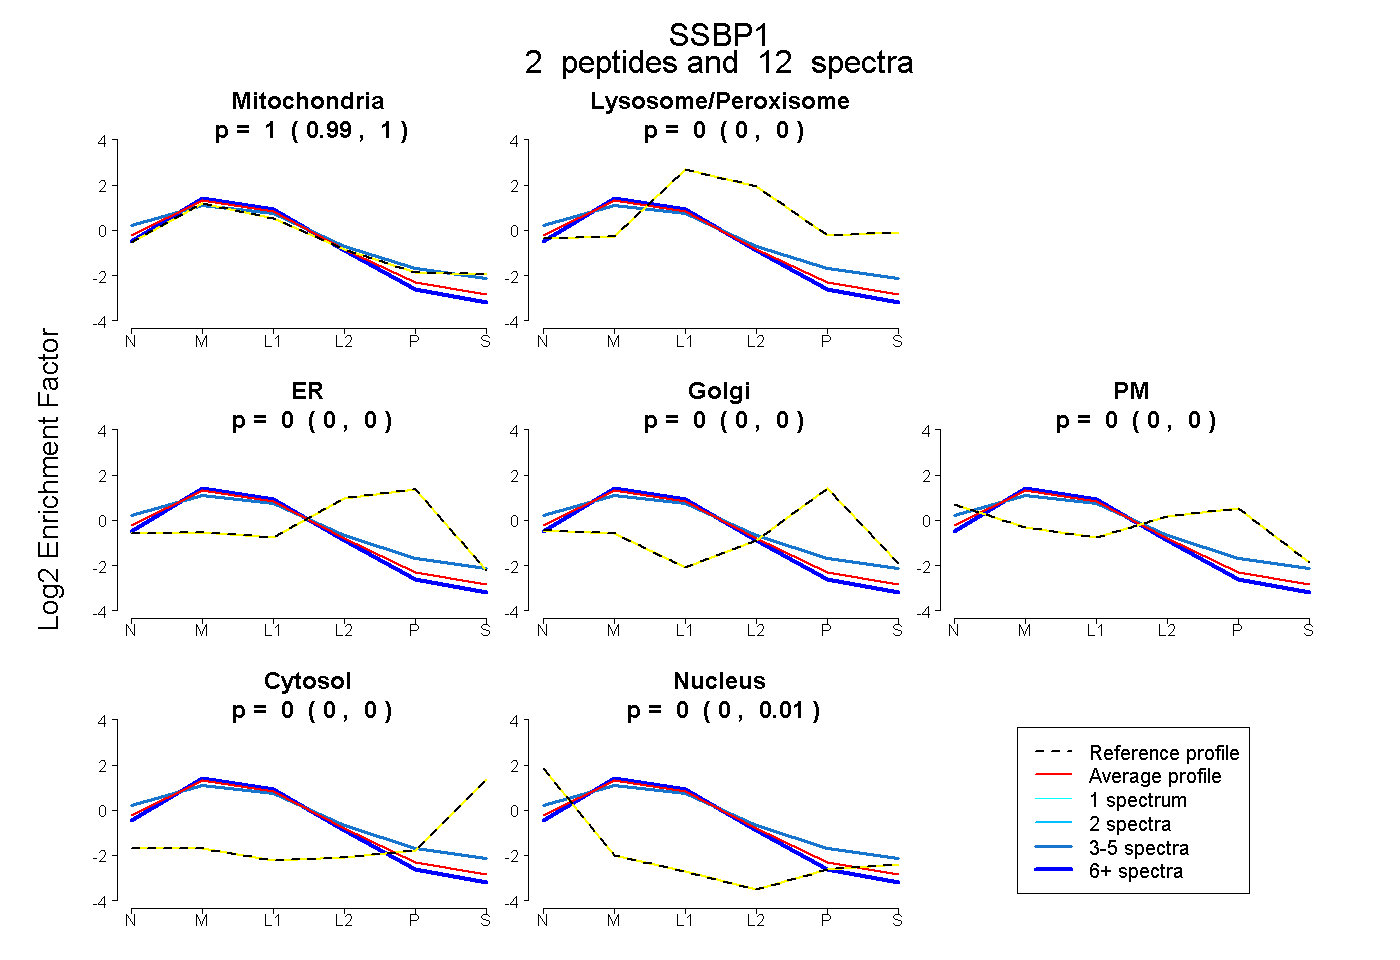 |
1.000 0.993 | 1.000 |
0.000 0.000 | 0.000 |
0.000 0.000 | 0.000 |
0.000 0.000 | 0.000 |
0.000 0.000 | 0.000 |
0.000 0.000 | 0.000 |
0.000 0.000 | 0.006 |
|||
| Plot | Lyso | Other | |||||||||||
| Expt C |
7 peptides |
165 spectra |
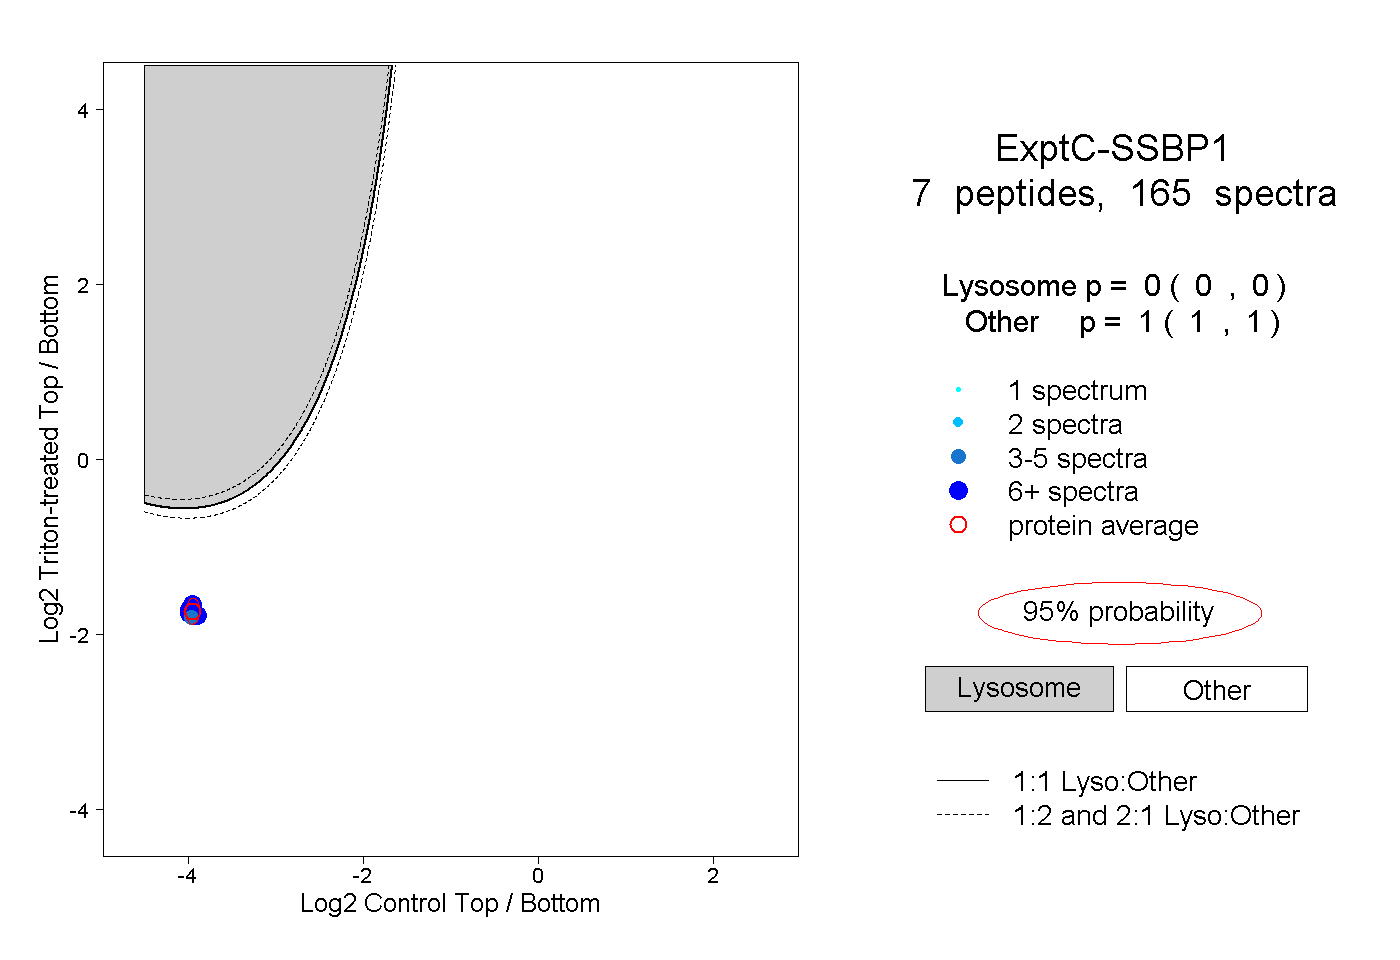 |
0.000 0.000 | 0.000 |
1.000 1.000 | 1.000 |
||||||||
| Plot | Lyso | Other | |||||||||||
| Expt D |
6 peptides |
15 spectra |
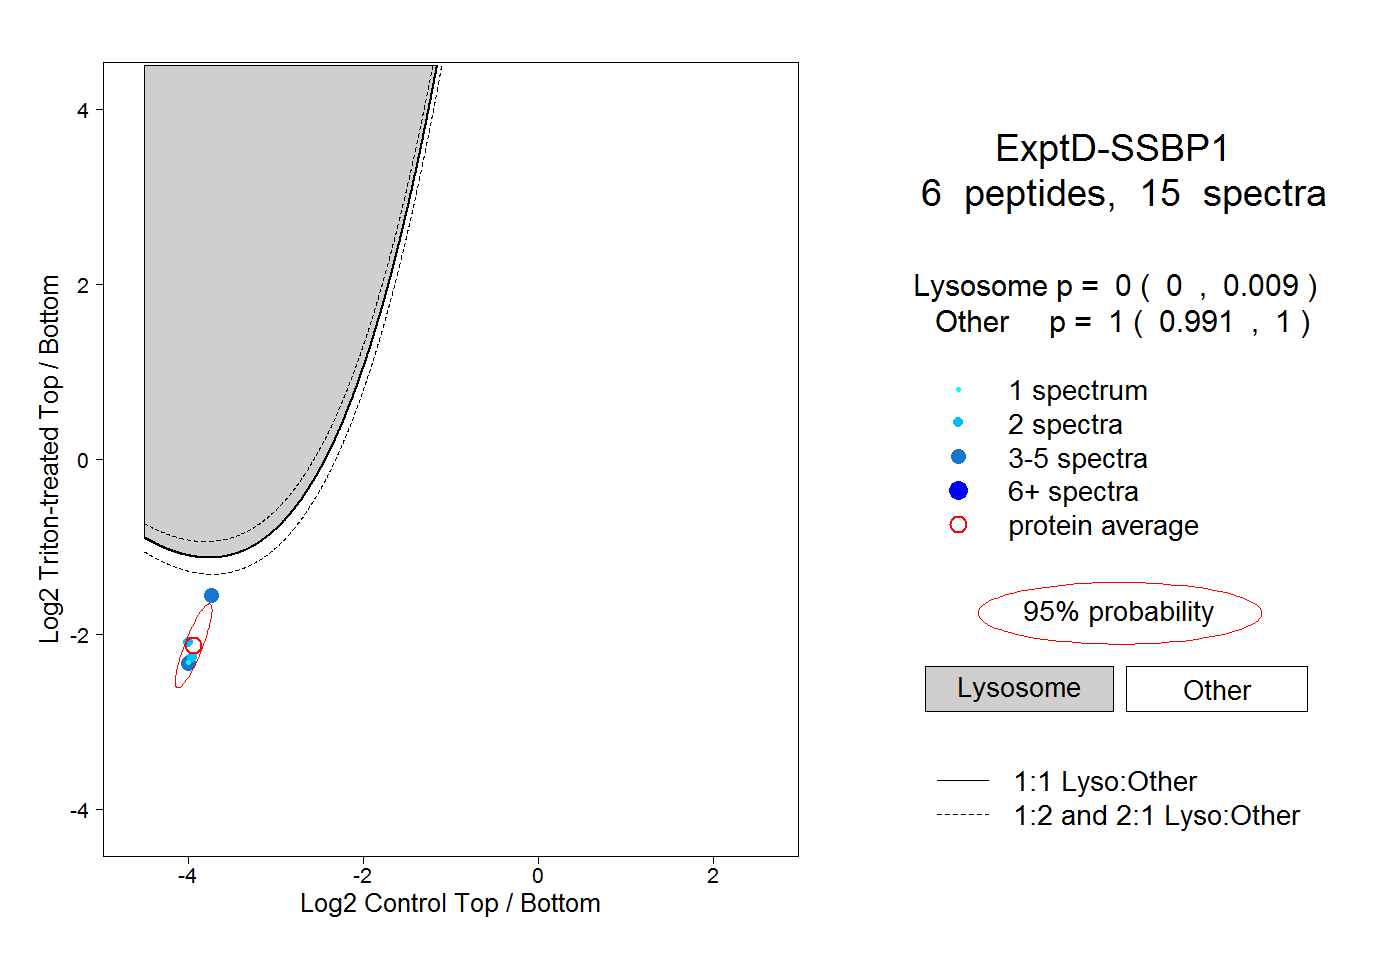 |
0.000 0.000 | 0.009 |
1.000 0.991 | 1.000 |