 11
11peptides
spectra
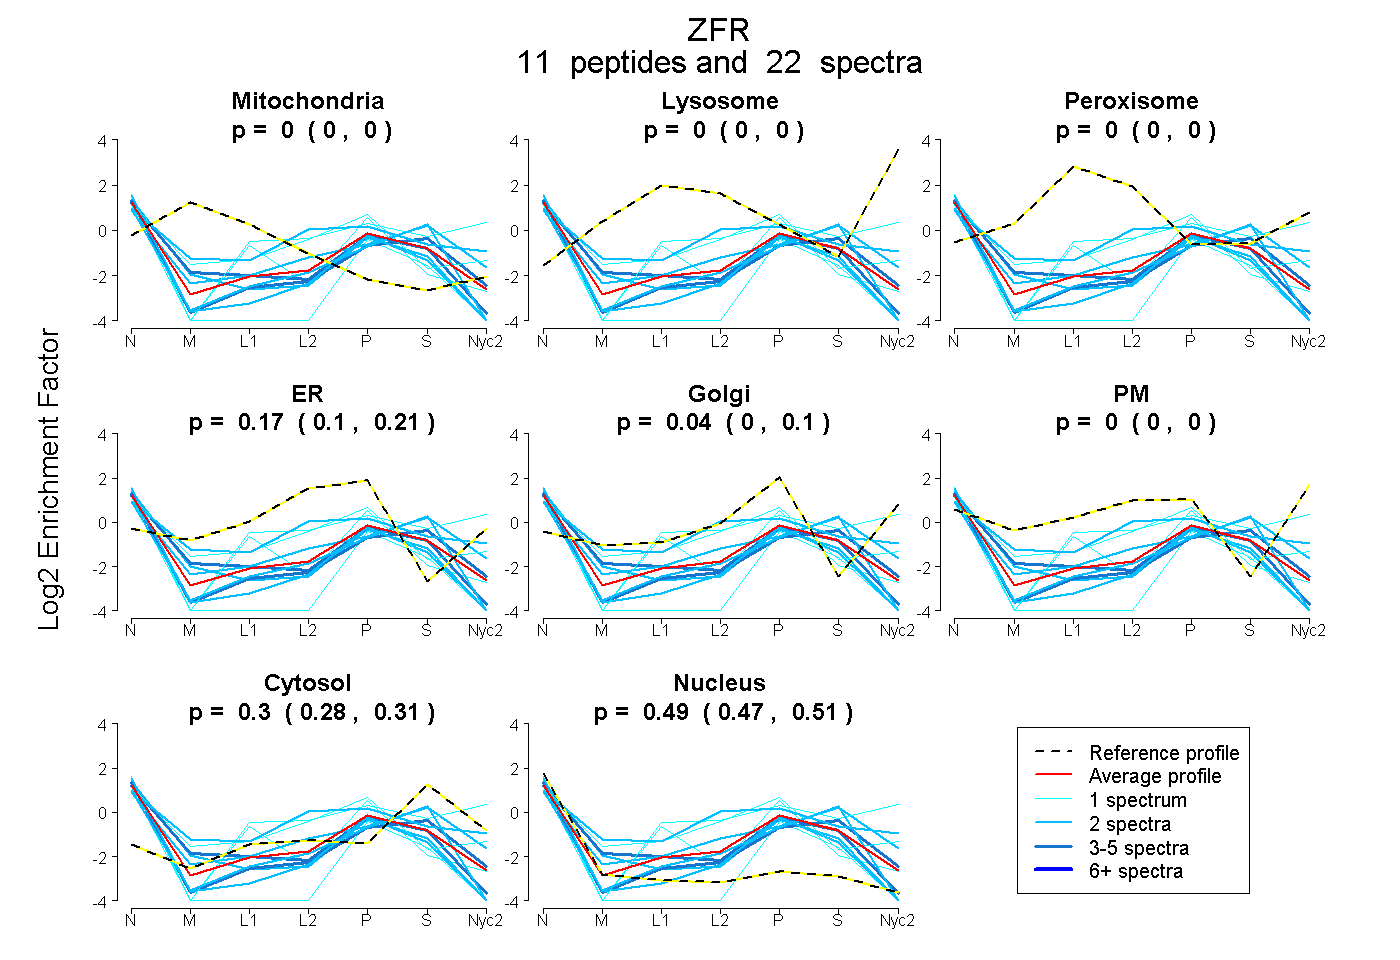
0.000 | 0.000
0.000 | 0.000
0.000 | 0.000
0.103 | 0.214
0.000 | 0.103
0.000 | 0.000
0.280 | 0.312
0.472 | 0.506
1peptide
spectrum
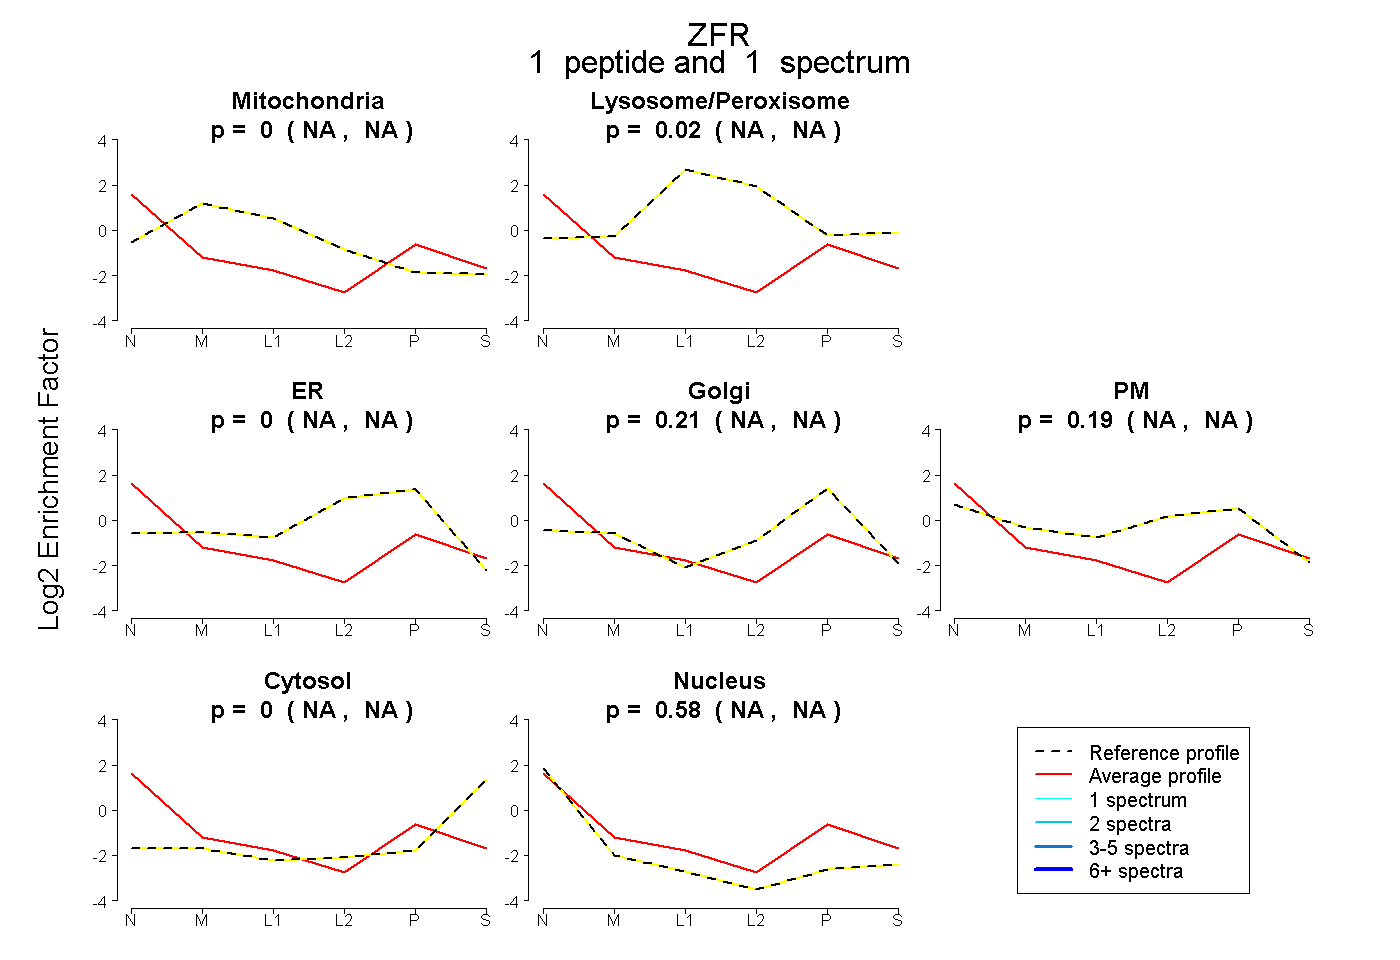
NA | NA
NA | NA
NA | NA
NA | NA
NA | NA
NA | NA
NA | NA
| Plot | Mito | Lyso | Perox | ER | Golgi | PM | Cytosol | Nucleus | |||||
| Expt A |
11 peptides |
22 spectra |
|
0.000 0.000 | 0.000 |
0.000 0.000 | 0.000 |
0.000 0.000 | 0.000 |
0.174 0.103 | 0.214 |
0.038 0.000 | 0.103 |
0.000 0.000 | 0.000 |
0.298 0.280 | 0.312 |
0.491 0.472 | 0.506 |
||
| Plot | Mito | Lyso or Perox | ER | Golgi | PM | Cytosol | Nucleus | ||||||
| Expt B |
1 peptide |
1 spectrum |
|
0.000 NA | NA |
0.022 NA | NA |
0.000 NA | NA |
0.208 NA | NA |
0.186 NA | NA |
0.000 NA | NA |
0.585 NA | NA |