 8
8peptides
spectra
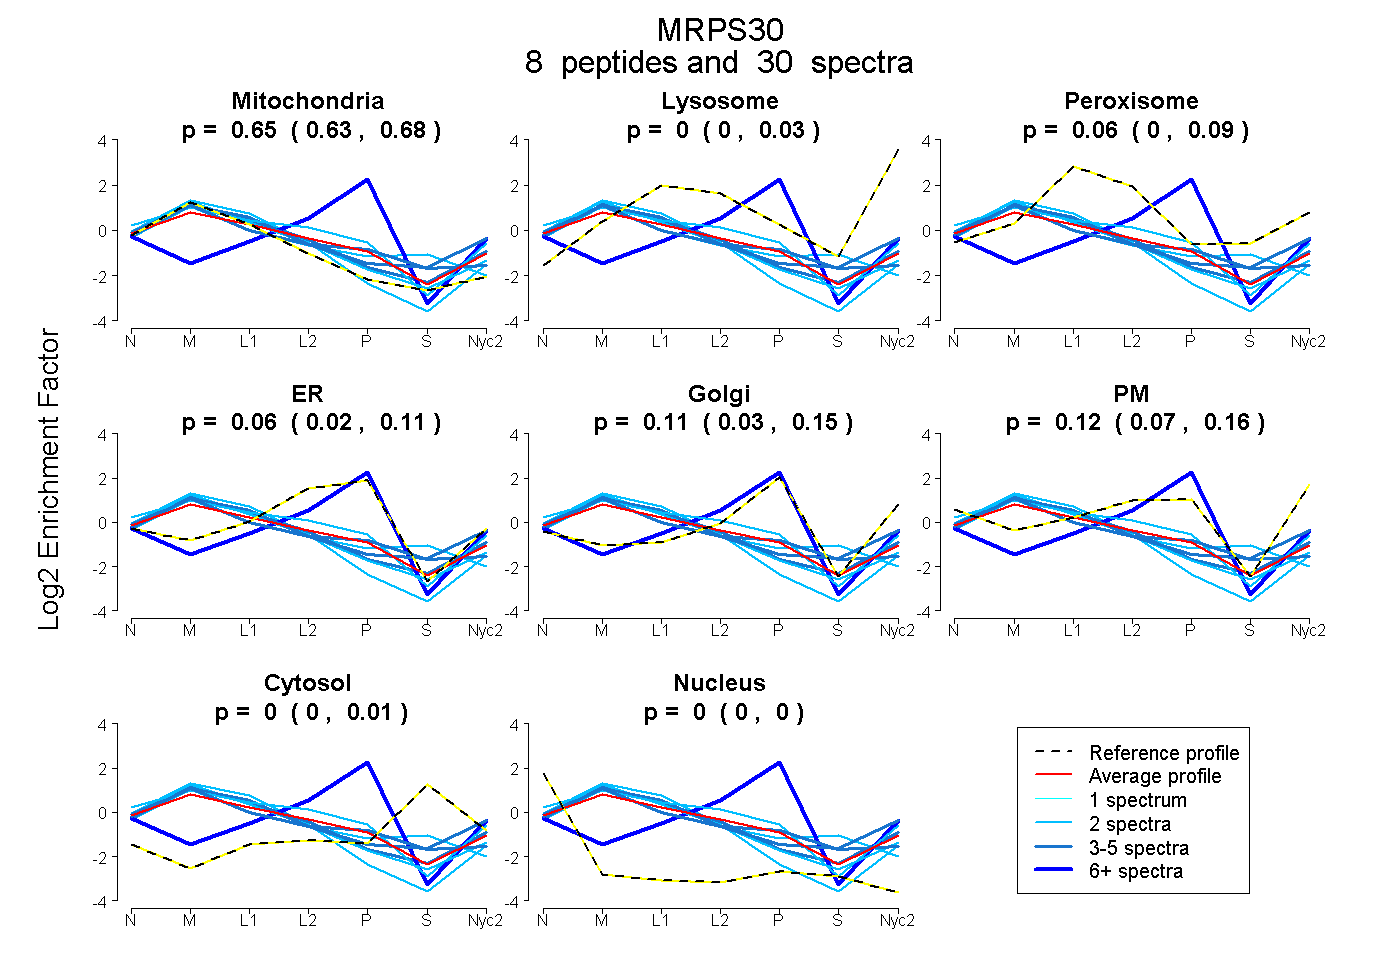
0.625 | 0.677
0.000 | 0.026
0.004 | 0.086
0.018 | 0.107
0.029 | 0.150
0.068 | 0.158
0.000 | 0.012
0.000 | 0.000
4peptides
spectra
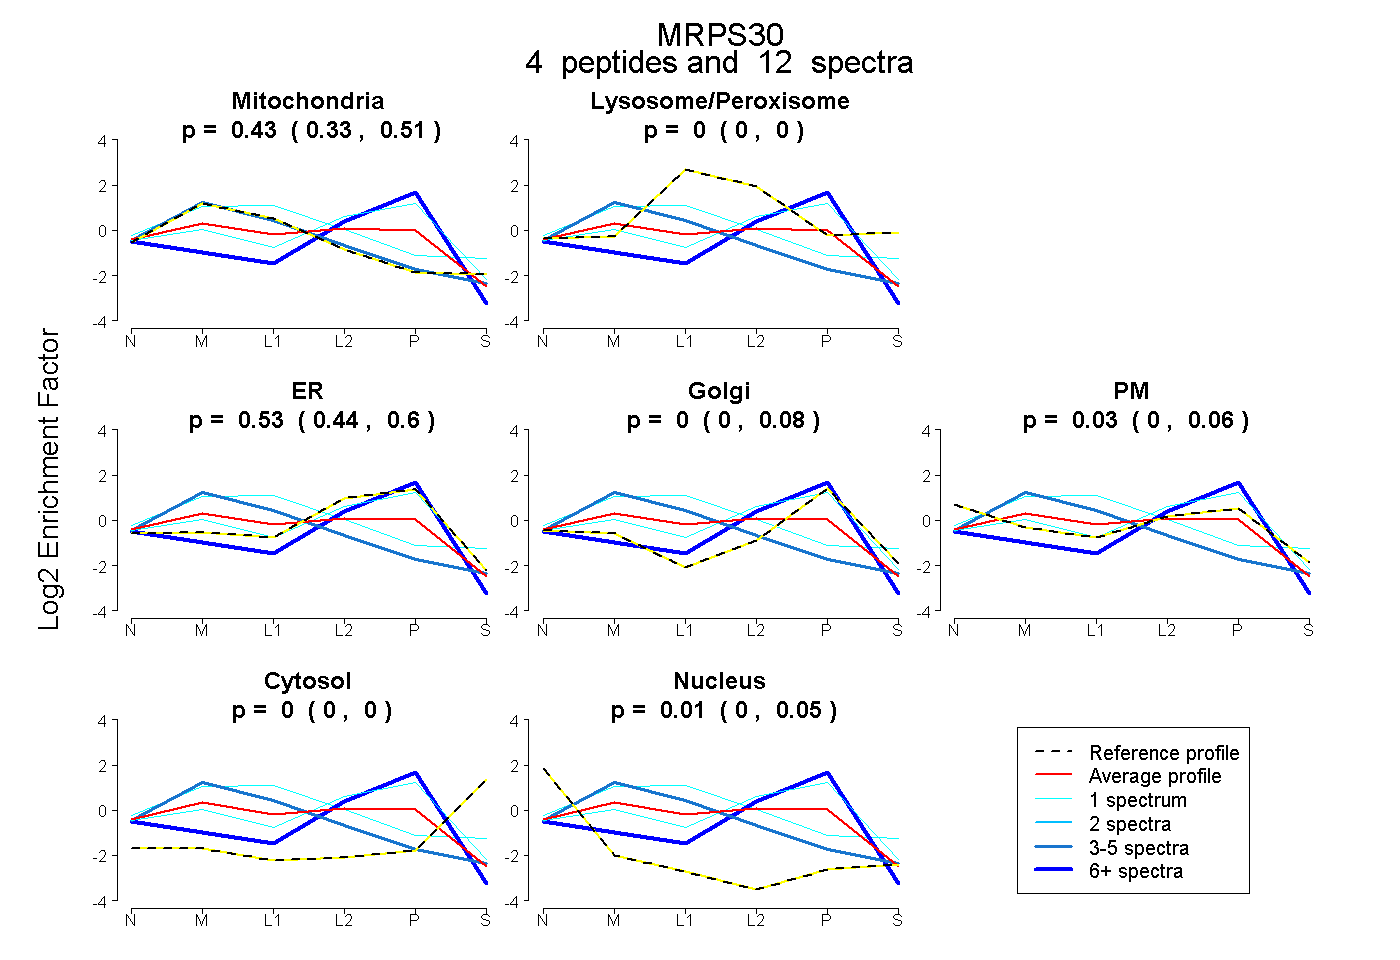
0.334 | 0.507
0.000 | 0.001
0.436 | 0.602
0.000 | 0.084
0.000 | 0.063
0.000 | 0.000
0.000 | 0.048
13peptides
spectra
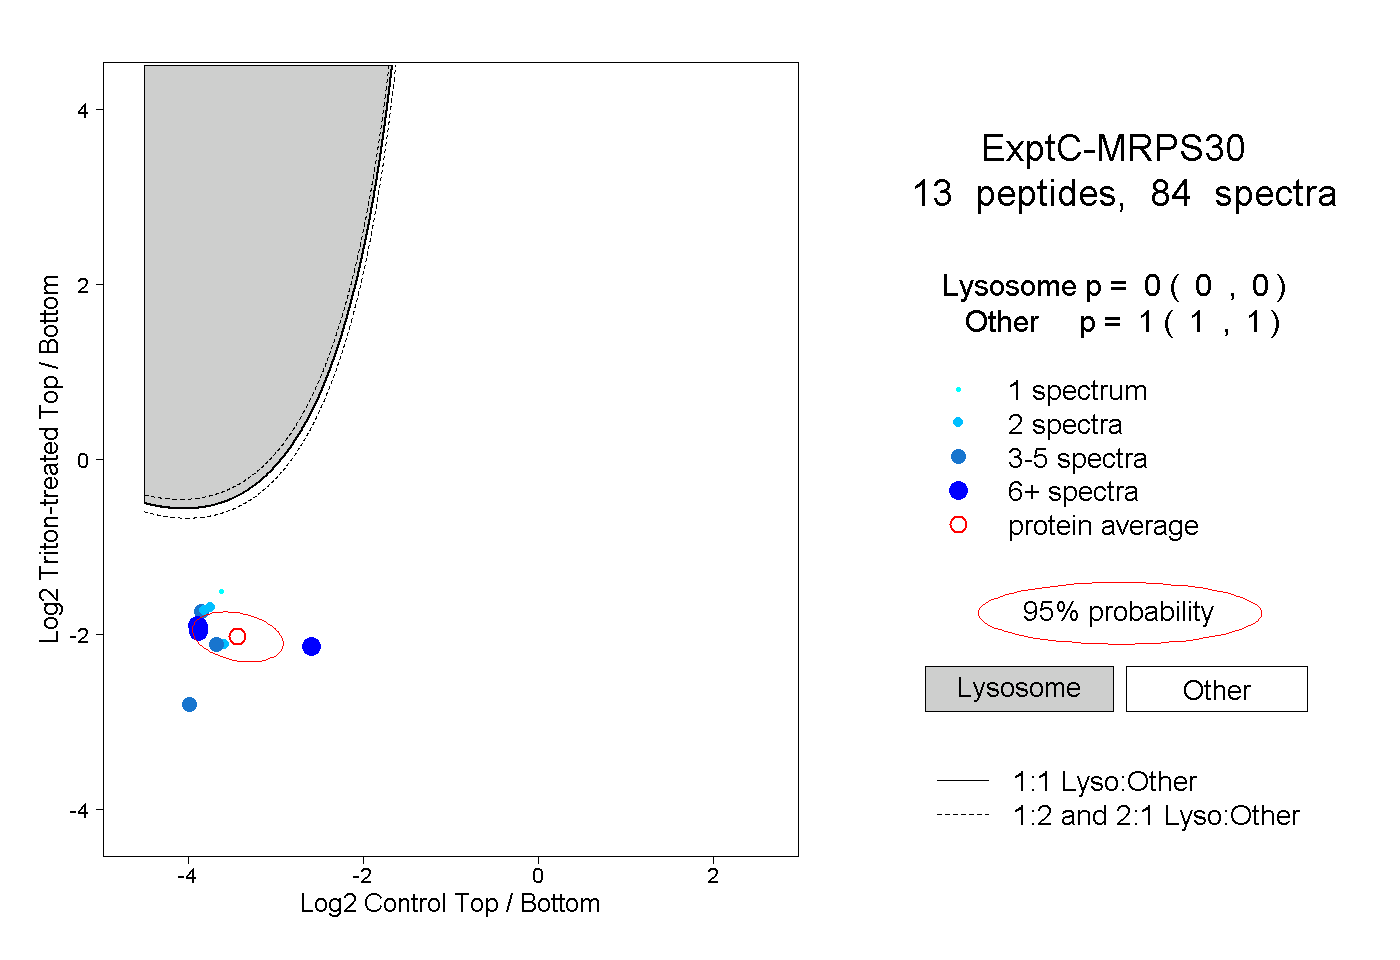
0.000 | 0.000
1.000 | 1.000
5peptides
spectra
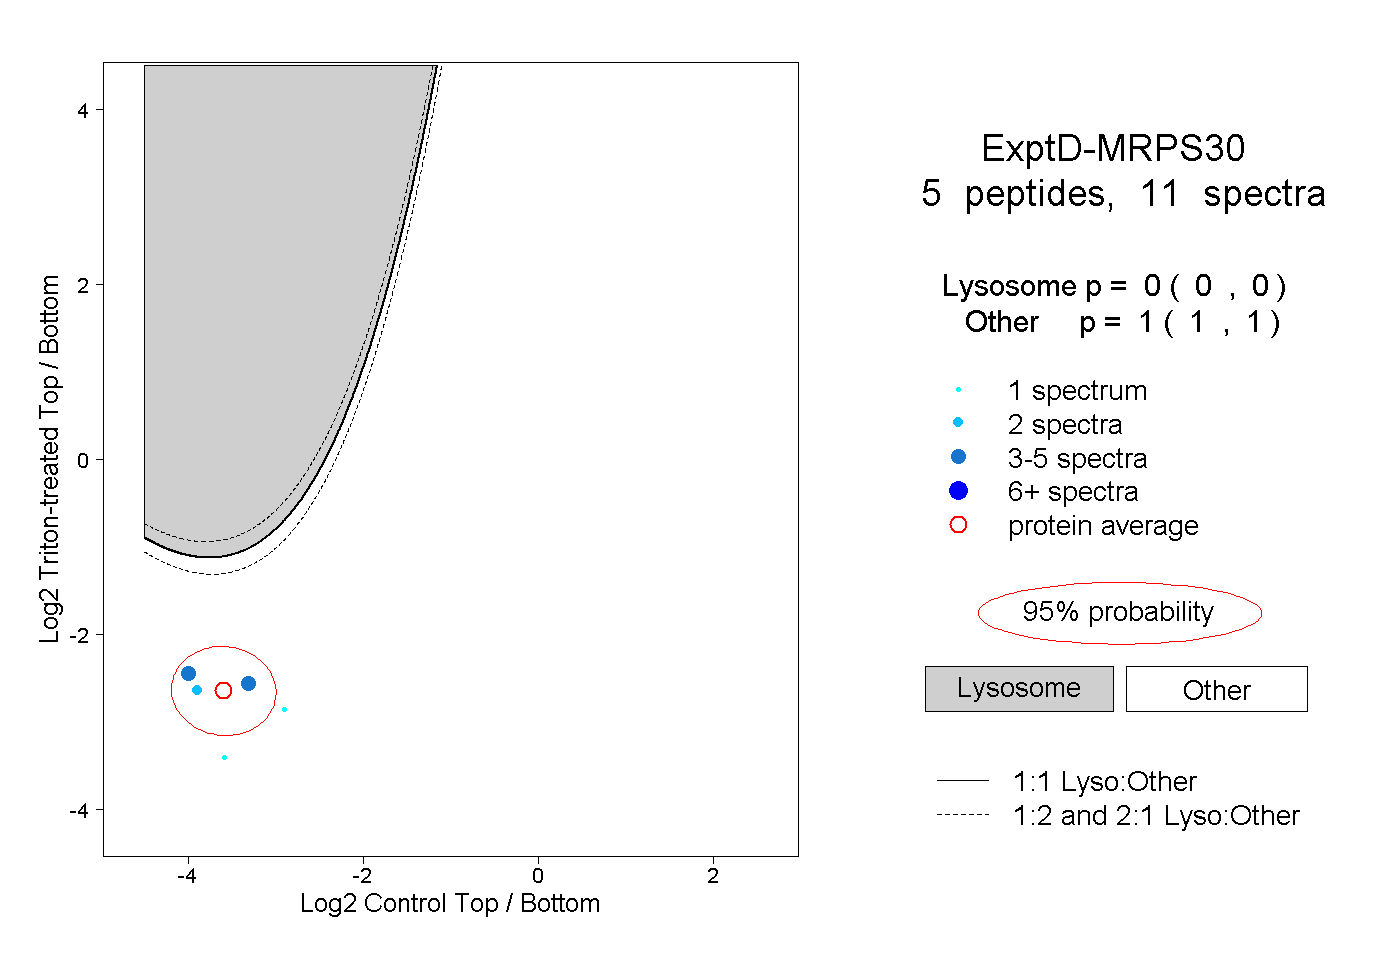
0.000 | 0.000
1.000 | 1.000