 8
8peptides
spectra
0.625 | 0.677
0.000 | 0.026
0.004 | 0.086
0.018 | 0.107
0.029 | 0.150
0.068 | 0.158
0.000 | 0.012
0.000 | 0.000
| Plot | Mito | Lyso | Perox | ER | Golgi | PM | Cytosol | Nucleus | |||||
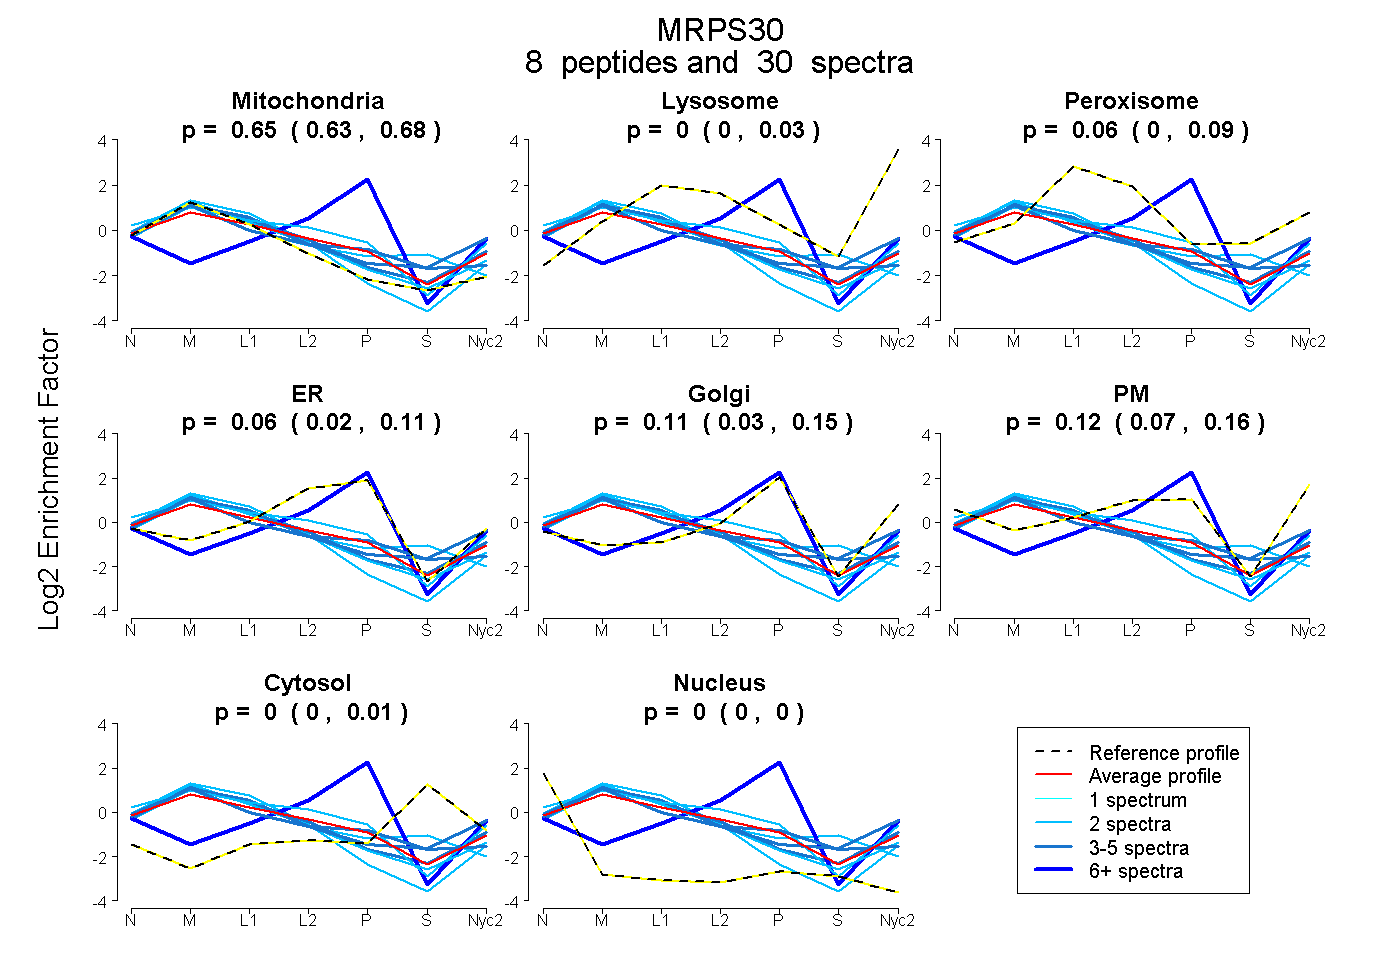
| Expt A |
8 peptides |
30 spectra |
|
0.653 0.625 | 0.677 |
0.000 0.000 | 0.026 |
0.064 0.004 | 0.086 |
0.057 0.018 | 0.107 |
0.109 0.029 | 0.150 |
0.118 0.068 | 0.158 |
0.000 0.000 | 0.012 |
0.000 0.000 | 0.000 |
| 2 spectra, AQLLTNQEK | 0.934 | 0.036 | 0.000 | 0.000 | 0.000 | 0.031 | 0.000 | 0.000 | ||
| 3 spectra, YVVHPQIPALNADR | 0.679 | 0.000 | 0.056 | 0.076 | 0.115 | 0.000 | 0.075 | 0.000 | ||
| 2 spectra, QNQADQVEVVFR | 0.840 | 0.036 | 0.019 | 0.000 | 0.000 | 0.105 | 0.000 | 0.000 | ||
| 5 spectra, ILAGHR | 0.780 | 0.136 | 0.014 | 0.000 | 0.000 | 0.069 | 0.000 | 0.000 | ||
| 2 spectra, YQINDKPHNQIR | 0.558 | 0.000 | 0.006 | 0.078 | 0.000 | 0.358 | 0.000 | 0.000 | ||
| 9 spectra, LPLFK | 0.000 | 0.000 | 0.000 | 0.577 | 0.362 | 0.000 | 0.000 | 0.061 | ||
| 2 spectra, AAVCDCILQEHVYVR | 0.683 | 0.000 | 0.073 | 0.057 | 0.000 | 0.000 | 0.187 | 0.000 | ||
| 5 spectra, RPVDFYWLR | 0.663 | 0.205 | 0.022 | 0.000 | 0.000 | 0.046 | 0.064 | 0.000 |
| Plot | Mito | Lyso or Perox | ER | Golgi | PM | Cytosol | Nucleus | ||||||
| Expt B |
4 peptides |
12 spectra |
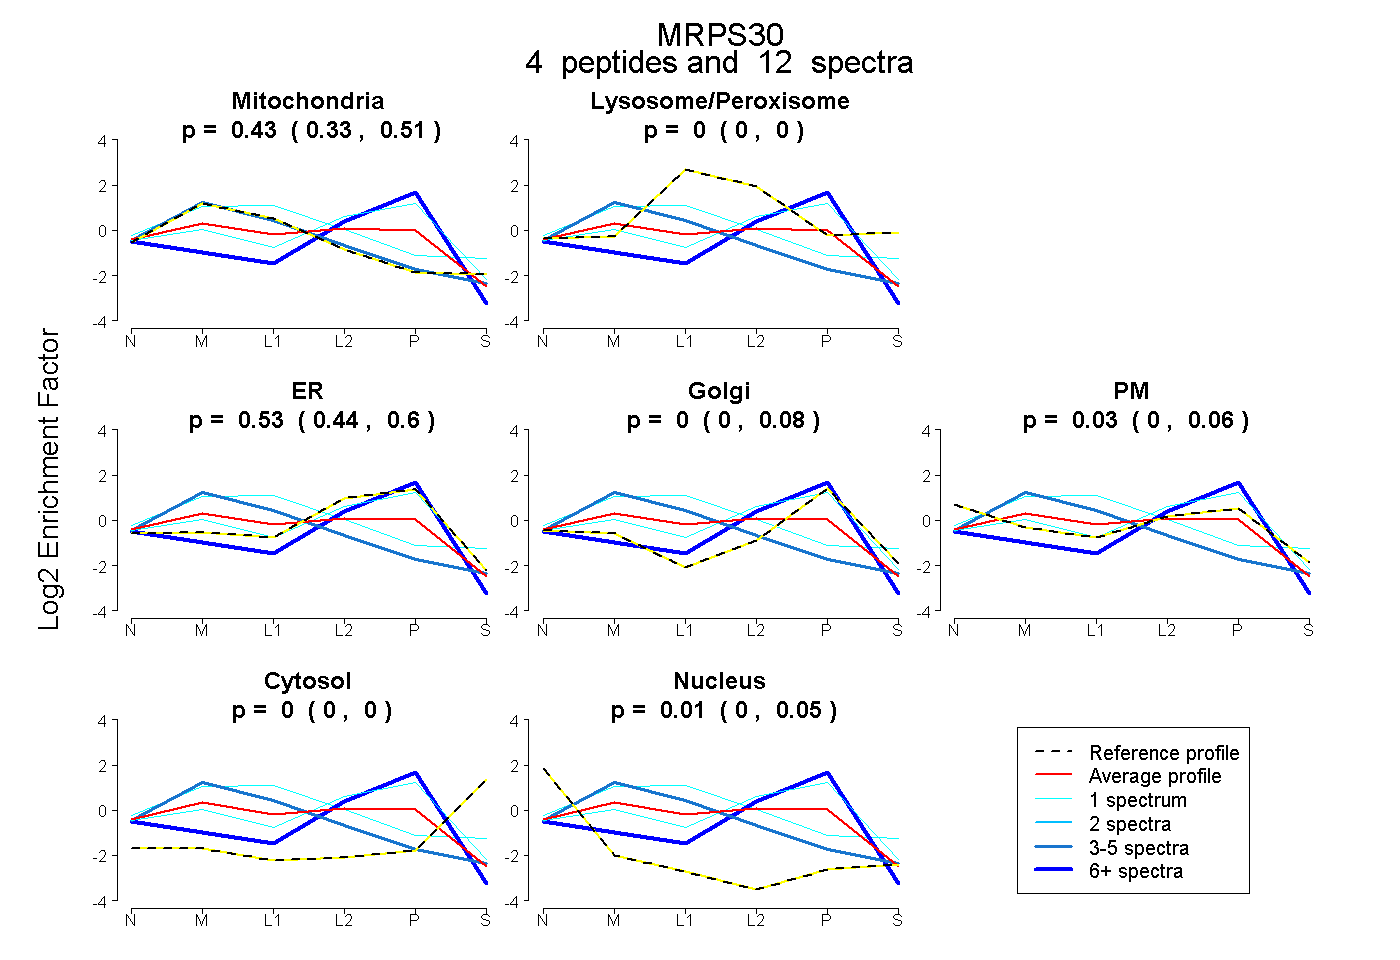 |
0.428 0.334 | 0.507 |
0.000 0.000 | 0.001 |
0.534 0.436 | 0.602 |
0.000 0.000 | 0.084 |
0.031 0.000 | 0.063 |
0.000 0.000 | 0.000 |
0.007 0.000 | 0.048 |
|||
| Plot | Lyso | Other | |||||||||||
| Expt C |
13 peptides |
84 spectra |
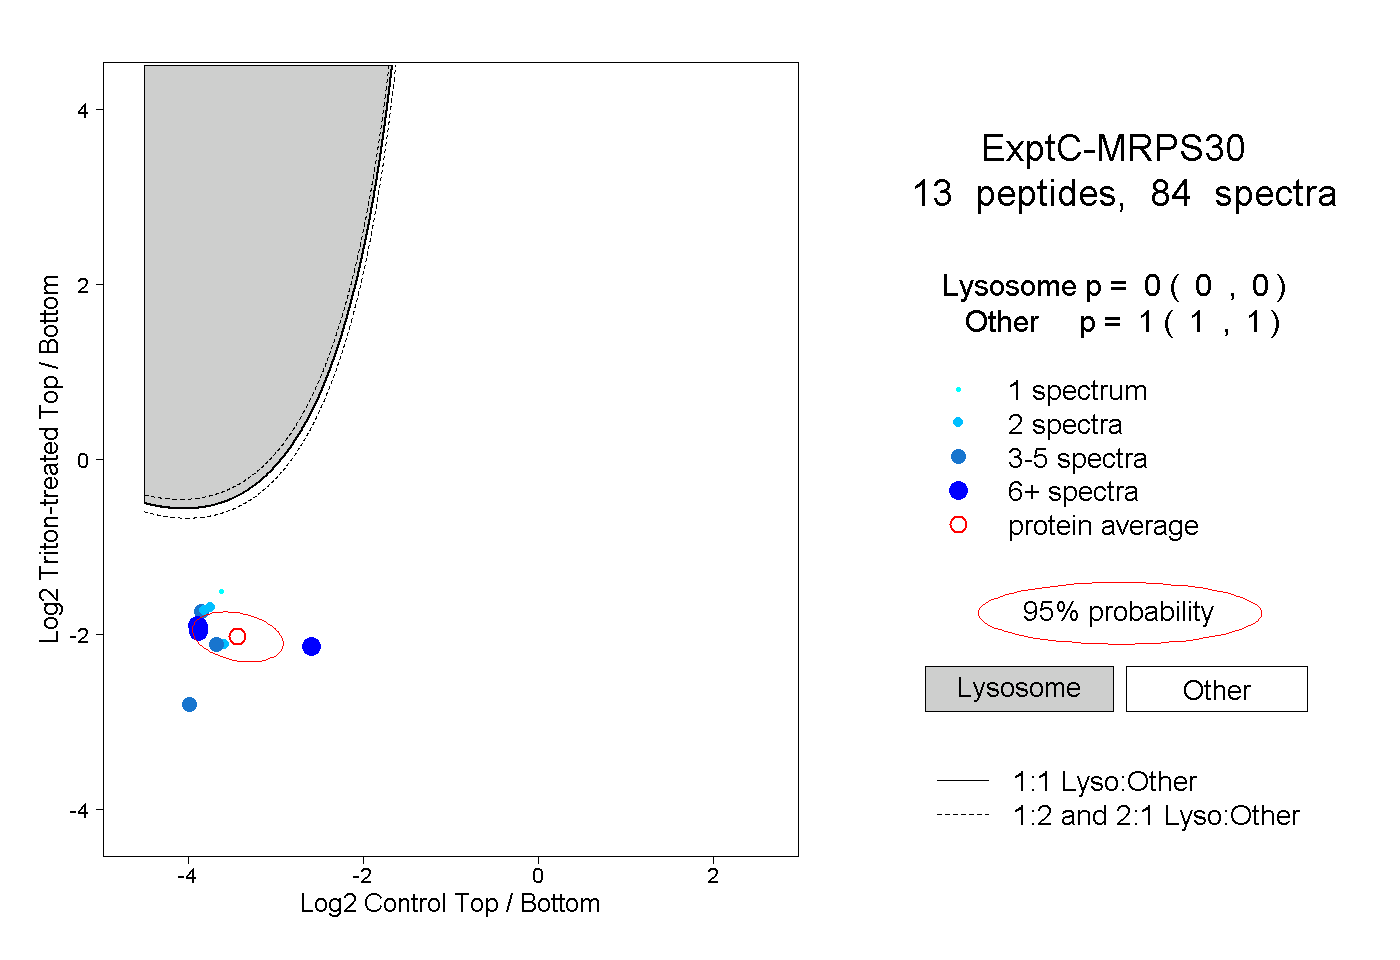 |
0.000 0.000 | 0.000 |
1.000 1.000 | 1.000 |
||||||||
| Plot | Lyso | Other | |||||||||||
| Expt D |
5 peptides |
11 spectra |
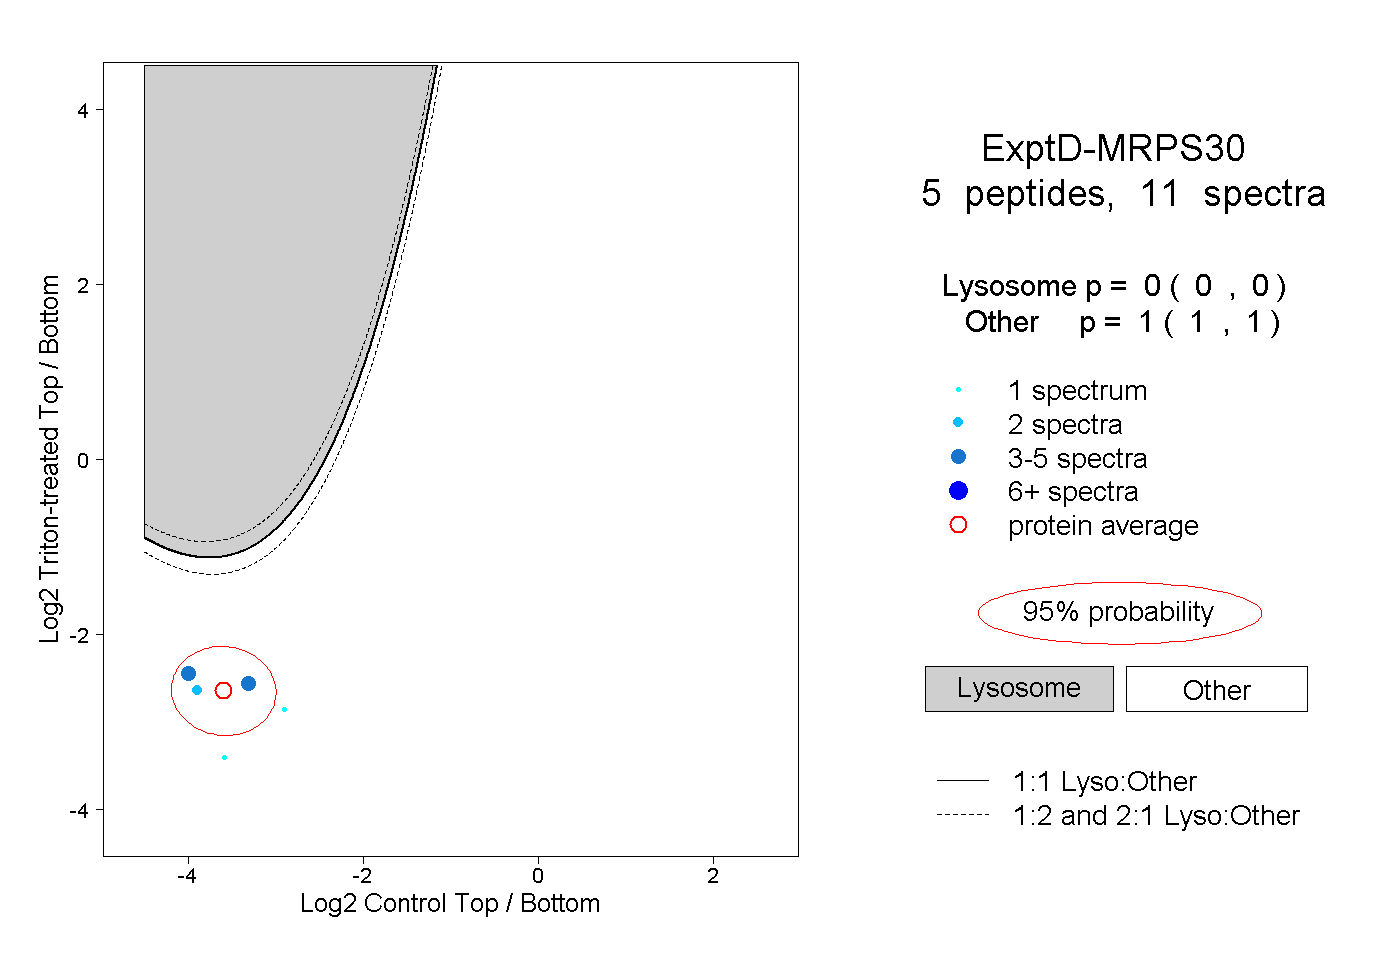 |
0.000 0.000 | 0.000 |
1.000 1.000 | 1.000 |