 5
5peptides
spectra
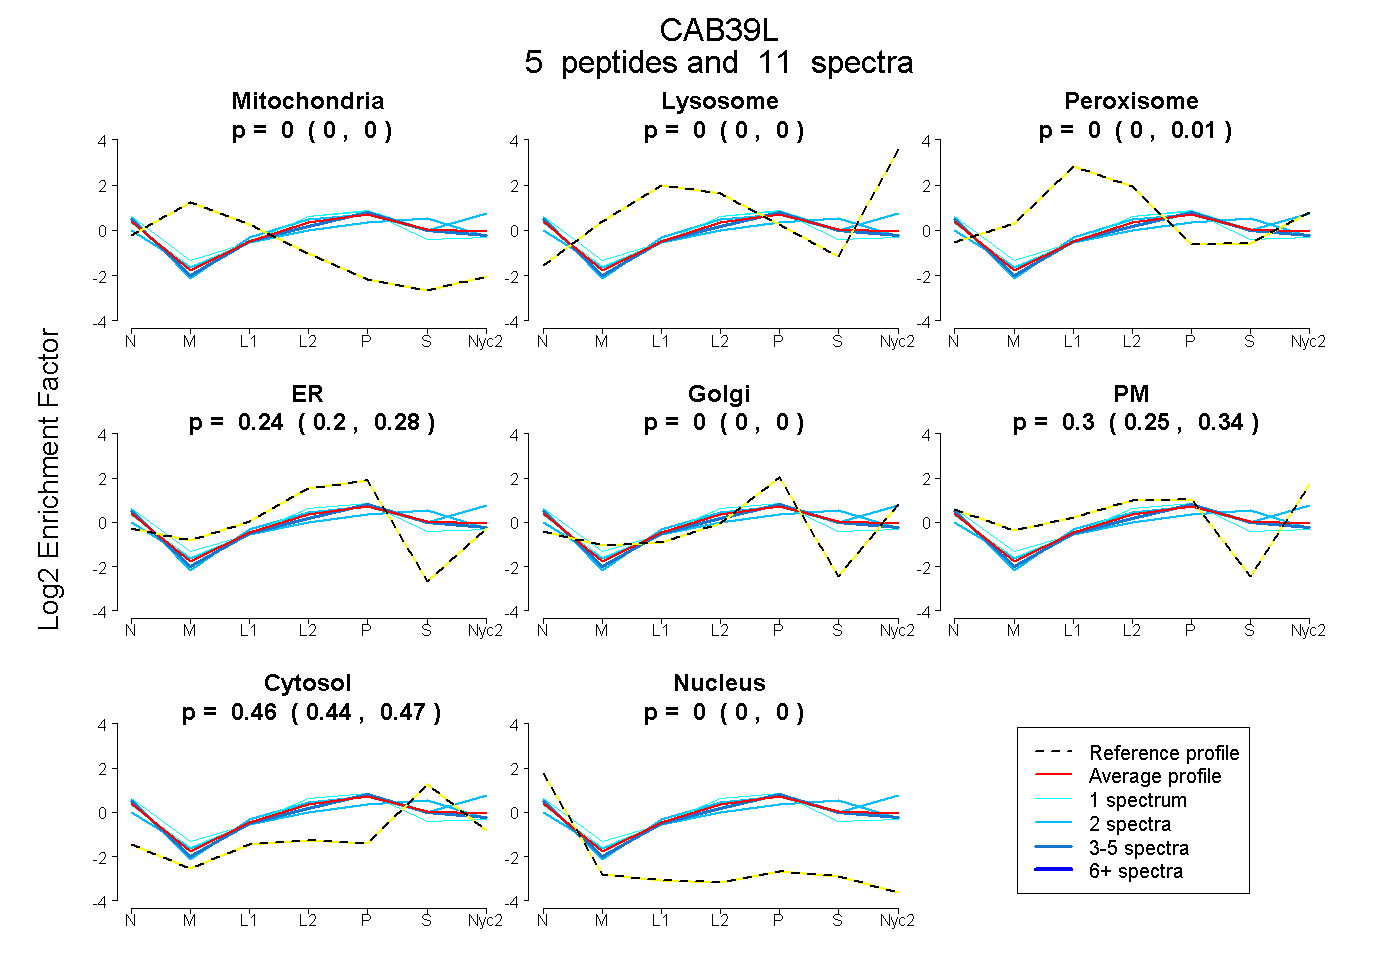
0.000 | 0.000
0.000 | 0.000
0.000 | 0.014
0.197 | 0.277
0.000 | 0.000
0.248 | 0.337
0.445 | 0.468
0.000 | 0.000
1peptide
spectra
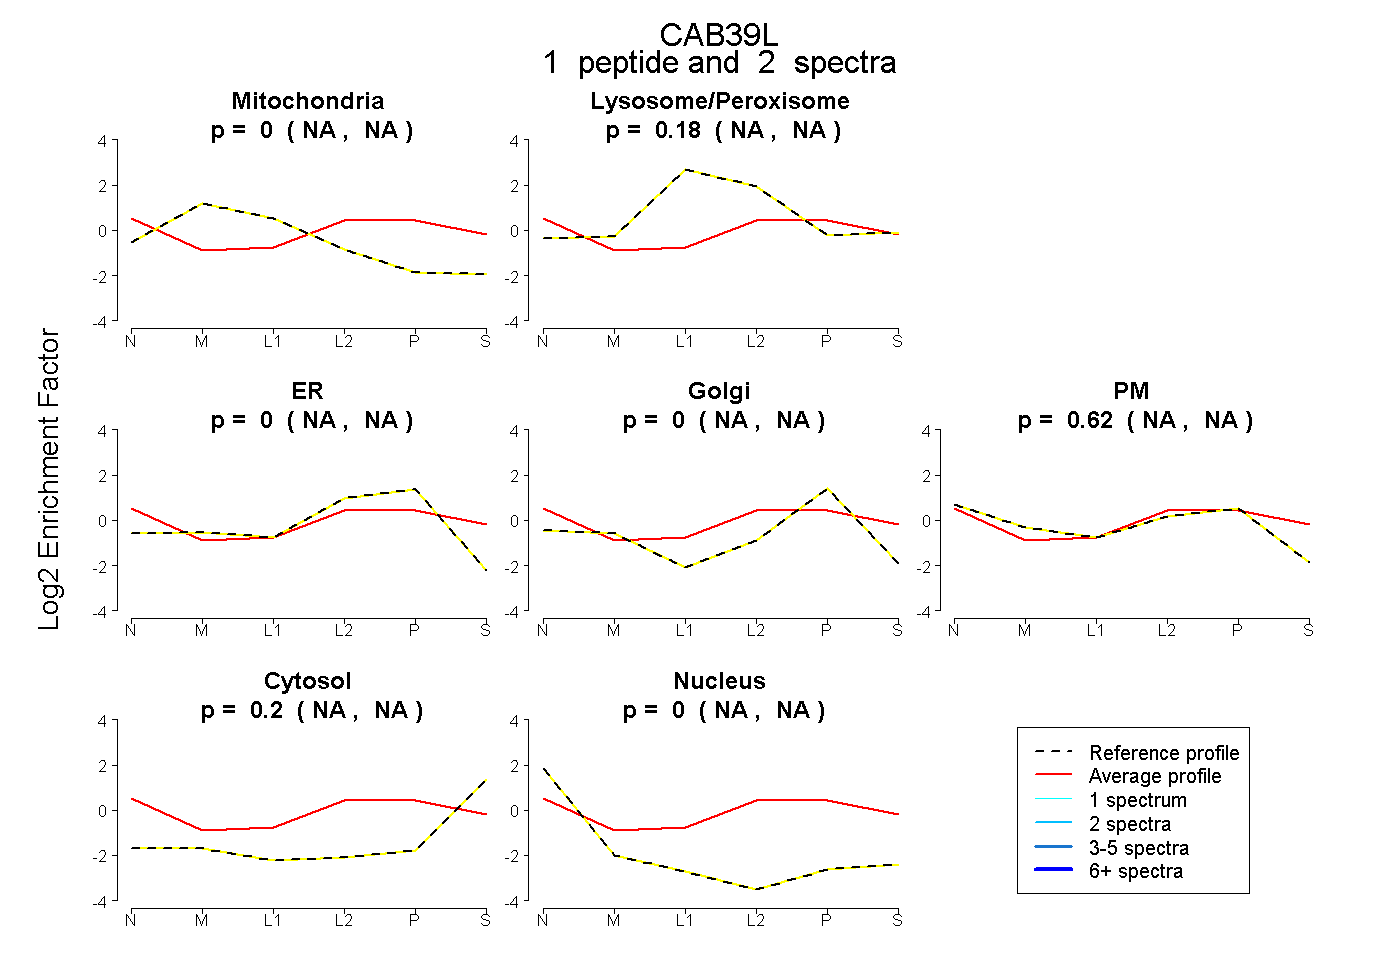
NA | NA
NA | NA
NA | NA
NA | NA
NA | NA
NA | NA
NA | NA
4peptides
spectra
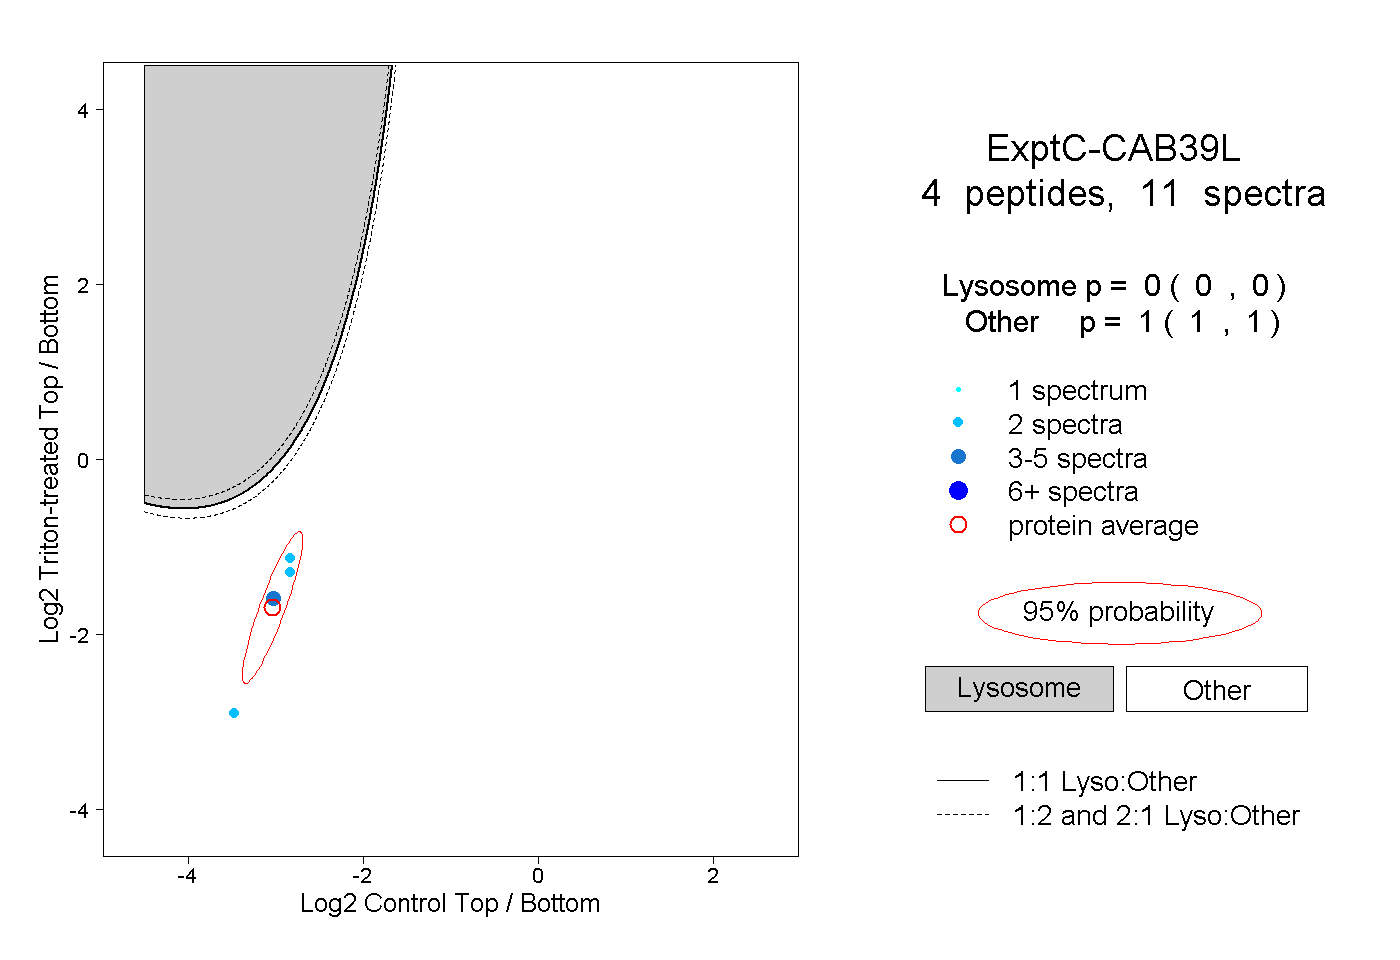
0.000 | 0.000
1.000 | 1.000
2peptides
spectra
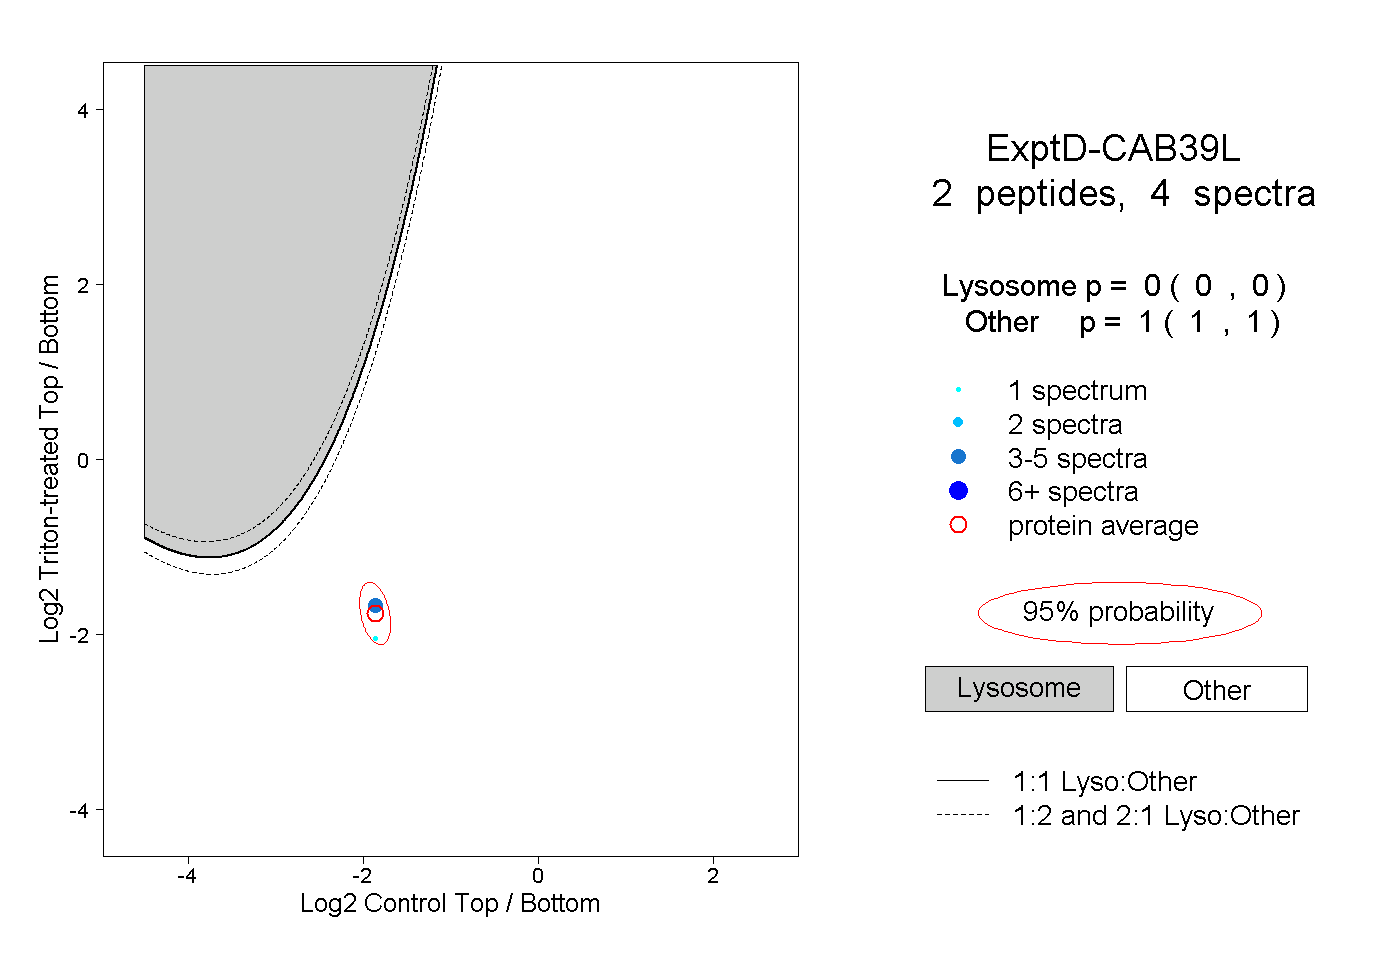
0.000 | 0.000
1.000 | 1.000