 5
5peptides
spectra
0.000 | 0.000
0.000 | 0.000
0.000 | 0.014
0.197 | 0.277
0.000 | 0.000
0.248 | 0.337
0.445 | 0.468
0.000 | 0.000
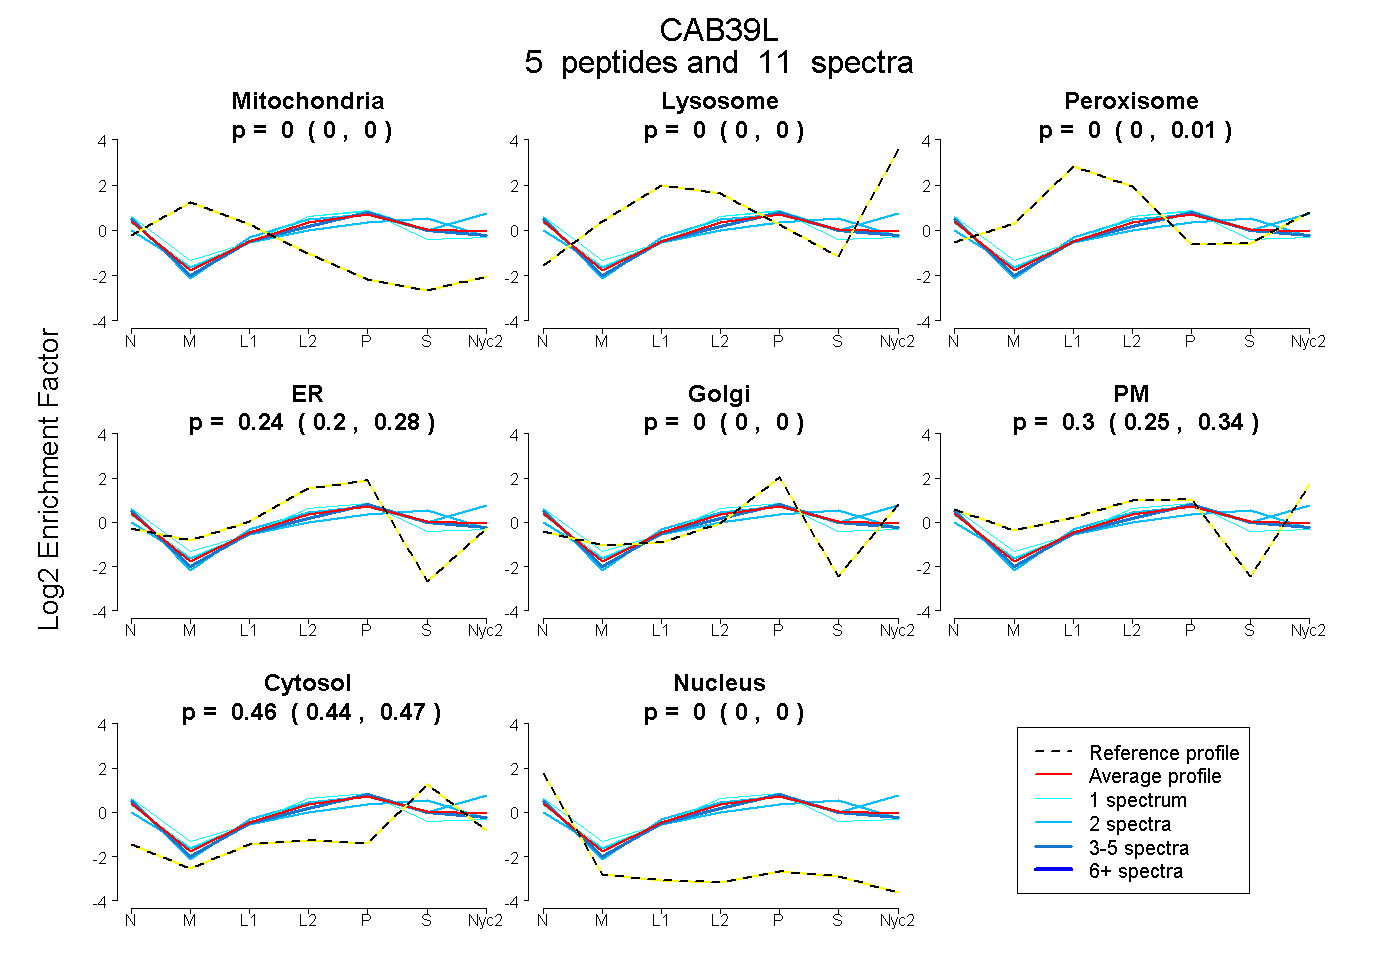
| Plot | Mito | Lyso | Perox | ER | Golgi | PM | Cytosol | Nucleus | |||||
| Expt A |
5 peptides |
11 spectra |
|
0.000 0.000 | 0.000 |
0.000 0.000 | 0.000 |
0.003 0.000 | 0.014 |
0.239 0.197 | 0.277 |
0.000 0.000 | 0.000 |
0.299 0.248 | 0.337 |
0.458 0.445 | 0.468 |
0.000 0.000 | 0.000 |
| 5 spectra, VILFSNQFR | 0.000 | 0.000 | 0.000 | 0.286 | 0.000 | 0.240 | 0.473 | 0.000 | ||
| 1 spectrum, TDDEQFADEK | 0.000 | 0.000 | 0.028 | 0.372 | 0.000 | 0.172 | 0.428 | 0.000 | ||
| 1 spectrum, LIEFLSSFQK | 0.000 | 0.000 | 0.004 | 0.377 | 0.000 | 0.247 | 0.357 | 0.017 | ||
| 2 spectra, DVTQIFNNILR | 0.000 | 0.000 | 0.000 | 0.003 | 0.000 | 0.570 | 0.427 | 0.000 | ||
| 2 spectra, GYEAPQIALR | 0.000 | 0.000 | 0.063 | 0.184 | 0.000 | 0.193 | 0.561 | 0.000 |
| Plot | Mito | Lyso or Perox | ER | Golgi | PM | Cytosol | Nucleus | ||||||
| Expt B |
1 peptide |
2 spectra |
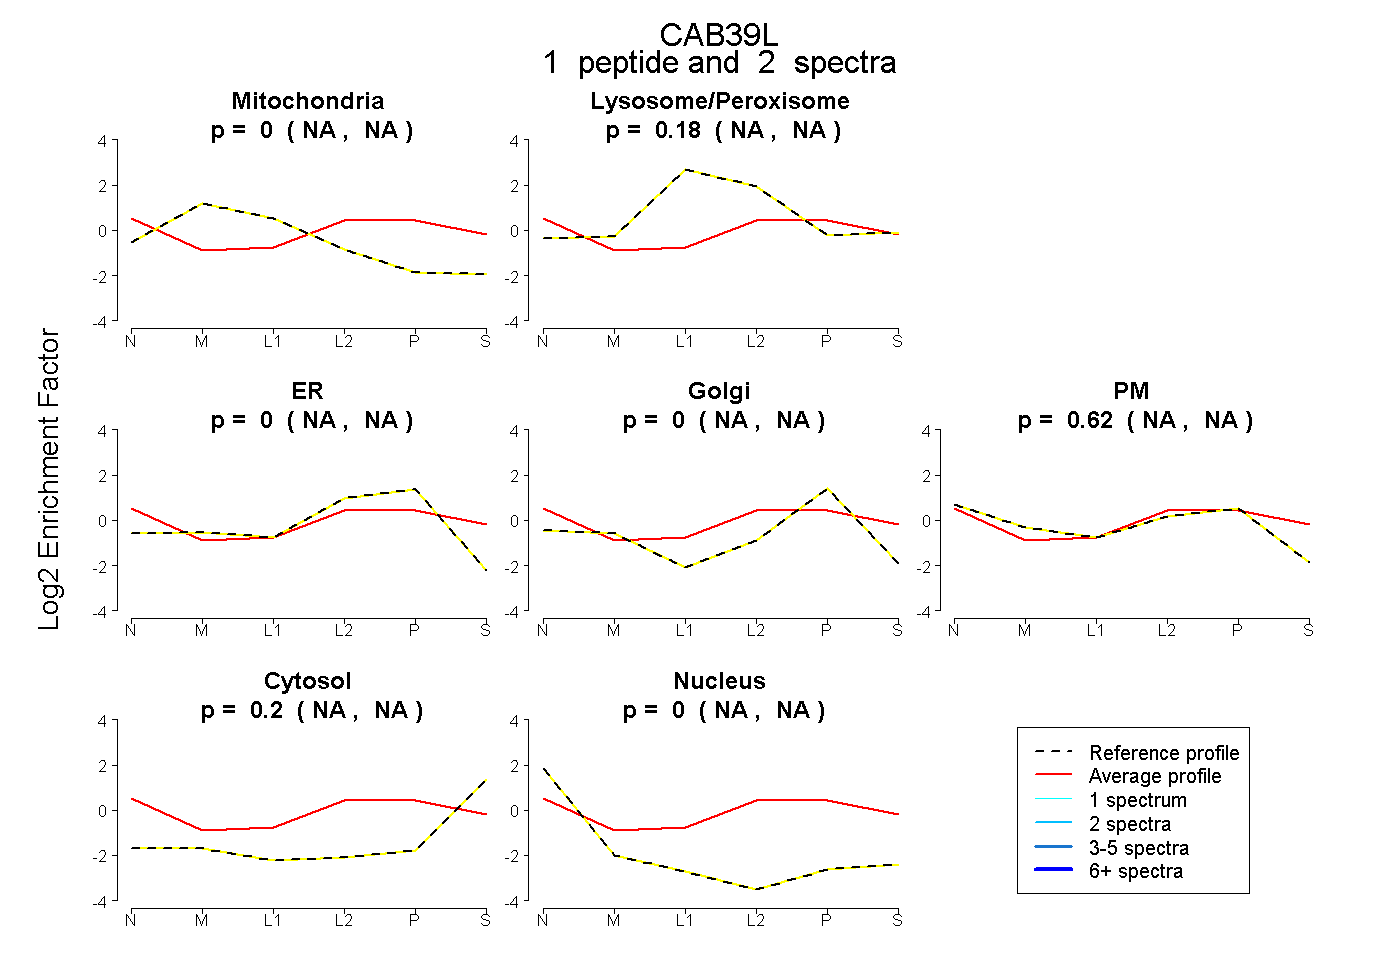 |
0.000 NA | NA |
0.180 NA | NA |
0.000 NA | NA |
0.000 NA | NA |
0.619 NA | NA |
0.200 NA | NA |
0.000 NA | NA |
|||
| Plot | Lyso | Other | |||||||||||
| Expt C |
4 peptides |
11 spectra |
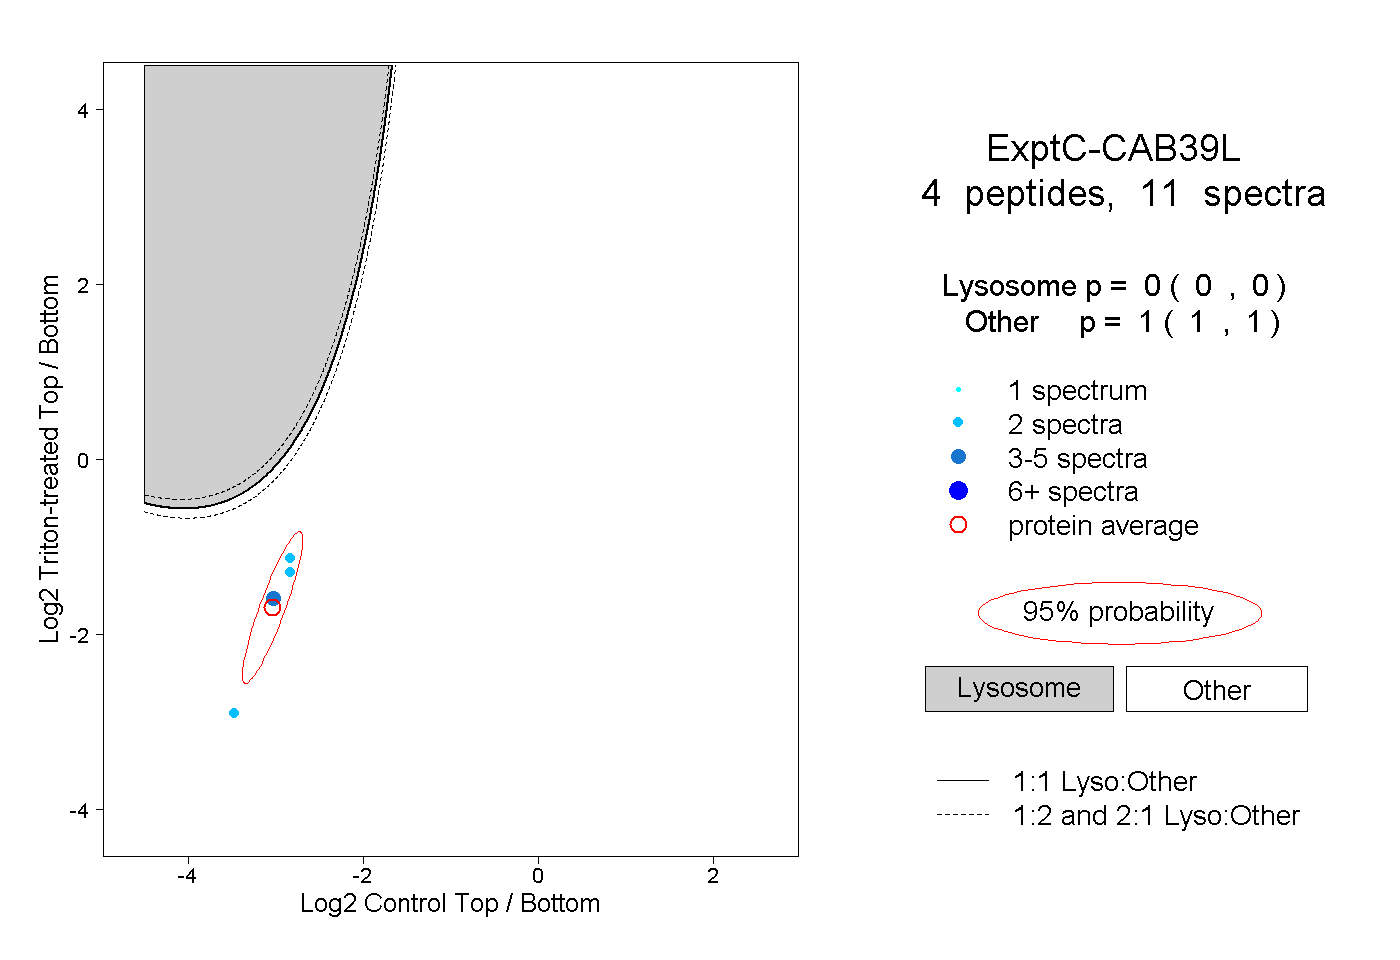 |
0.000 0.000 | 0.000 |
1.000 1.000 | 1.000 |
||||||||
| Plot | Lyso | Other | |||||||||||
| Expt D |
2 peptides |
4 spectra |
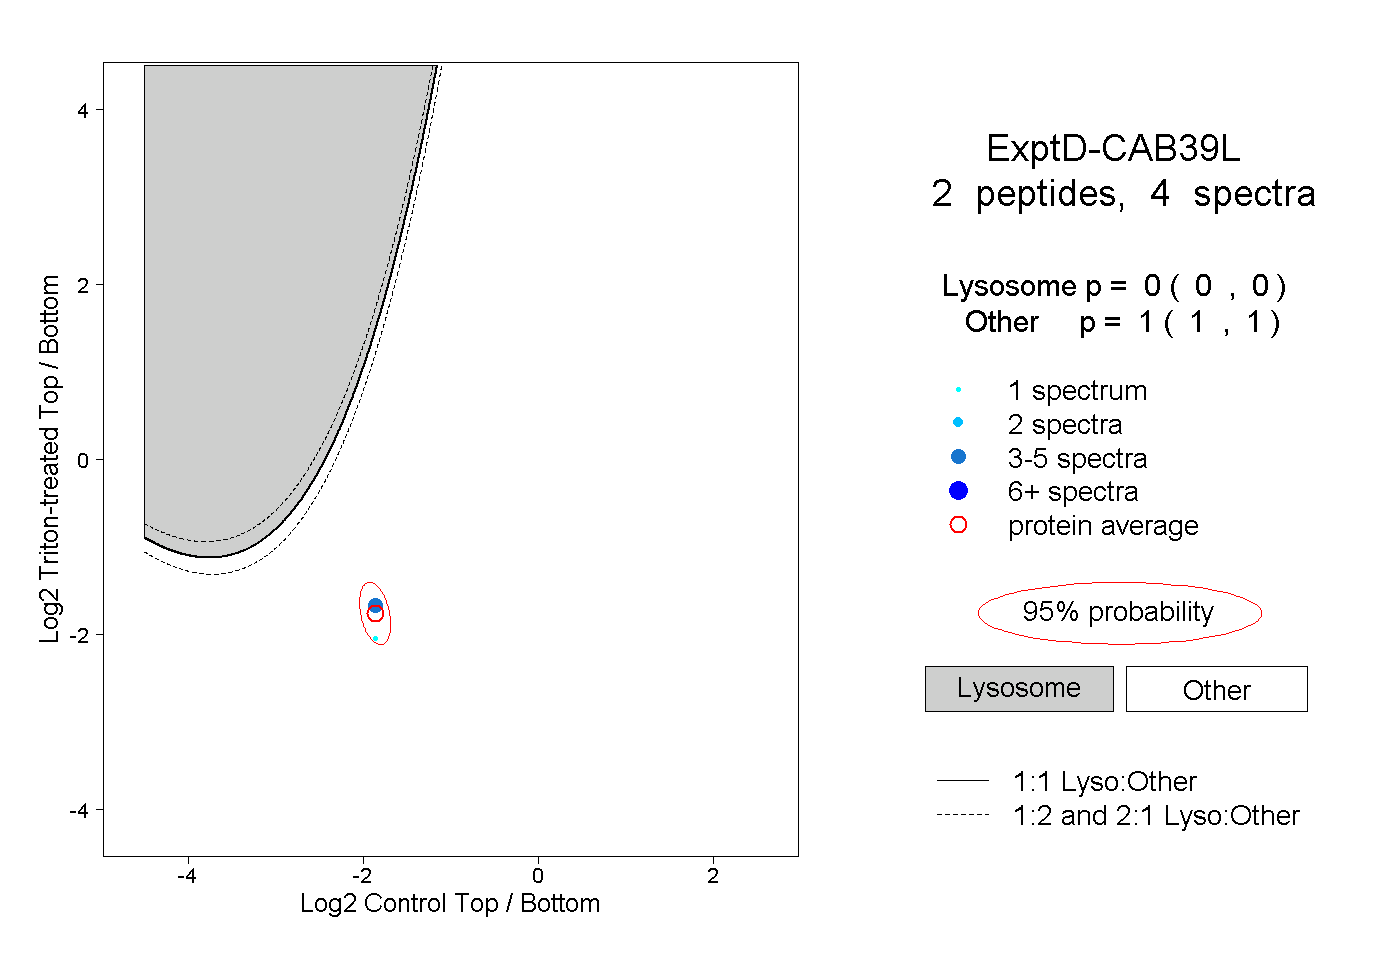 |
0.000 0.000 | 0.000 |
1.000 1.000 | 1.000 |