 8
8peptides
spectra
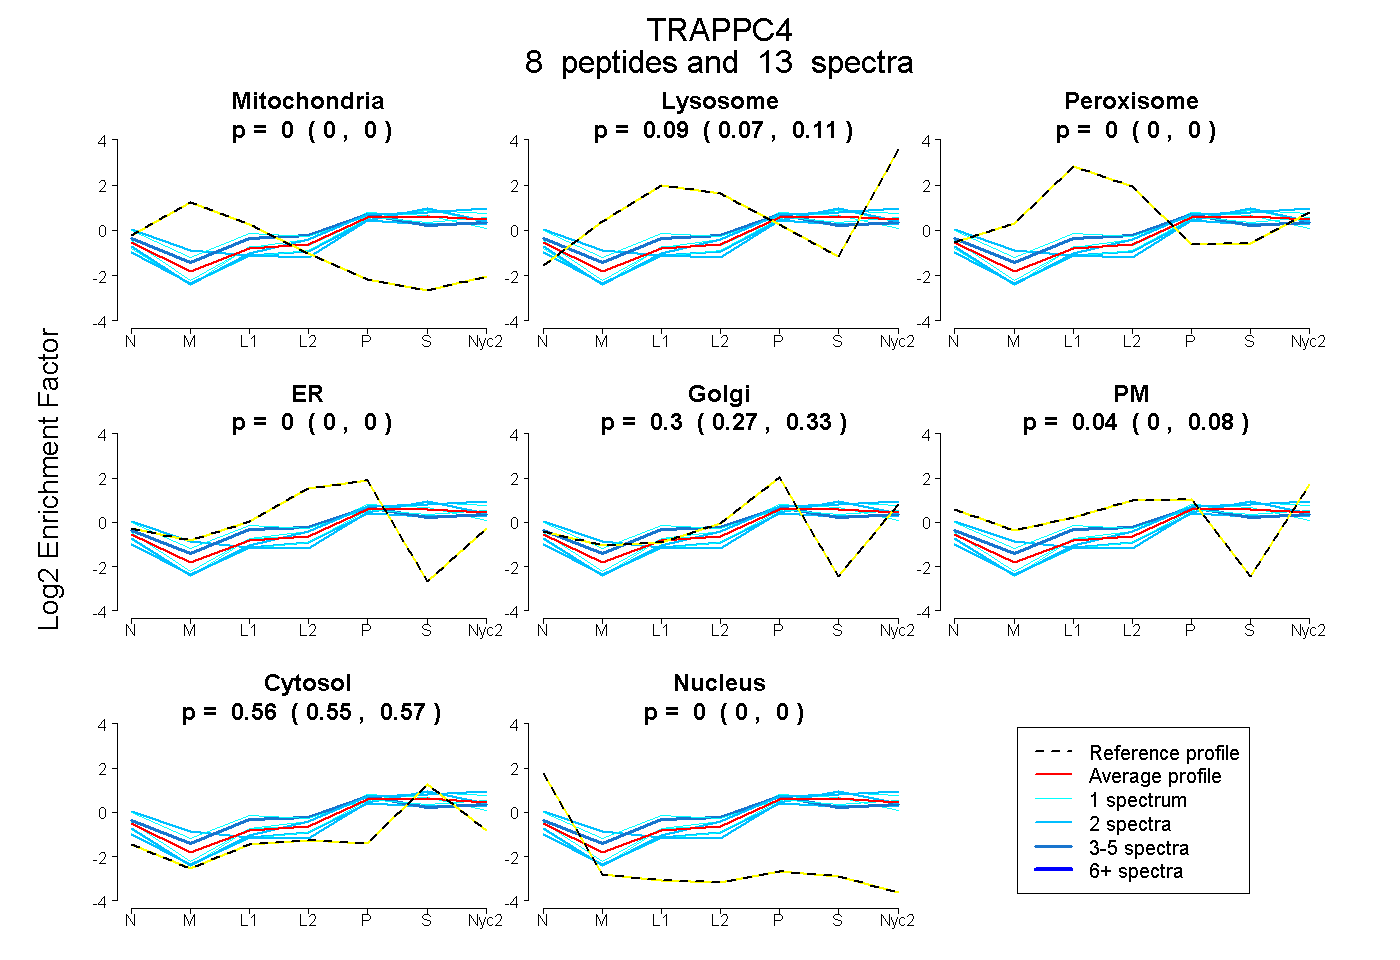
0.000 | 0.000
0.072 | 0.112
0.000 | 0.000
0.000 | 0.000
0.267 | 0.329
0.000 | 0.084
0.550 | 0.572
0.000 | 0.000
3peptides
spectra
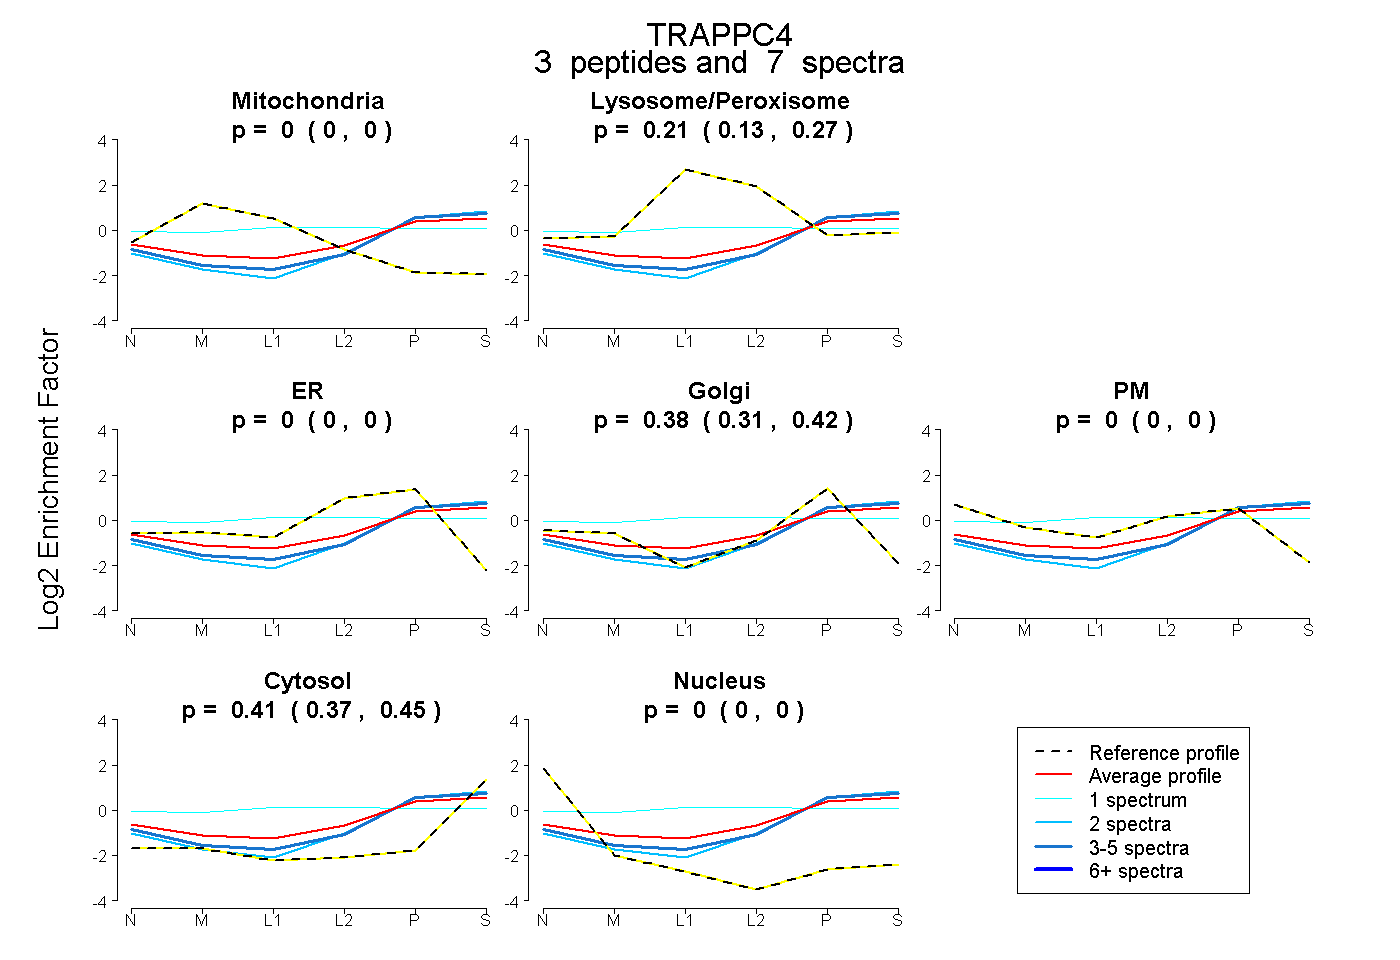
0.000 | 0.000
0.126 | 0.273
0.000 | 0.004
0.307 | 0.424
0.000 | 0.000
0.366 | 0.453
0.000 | 0.000
5peptides
spectra
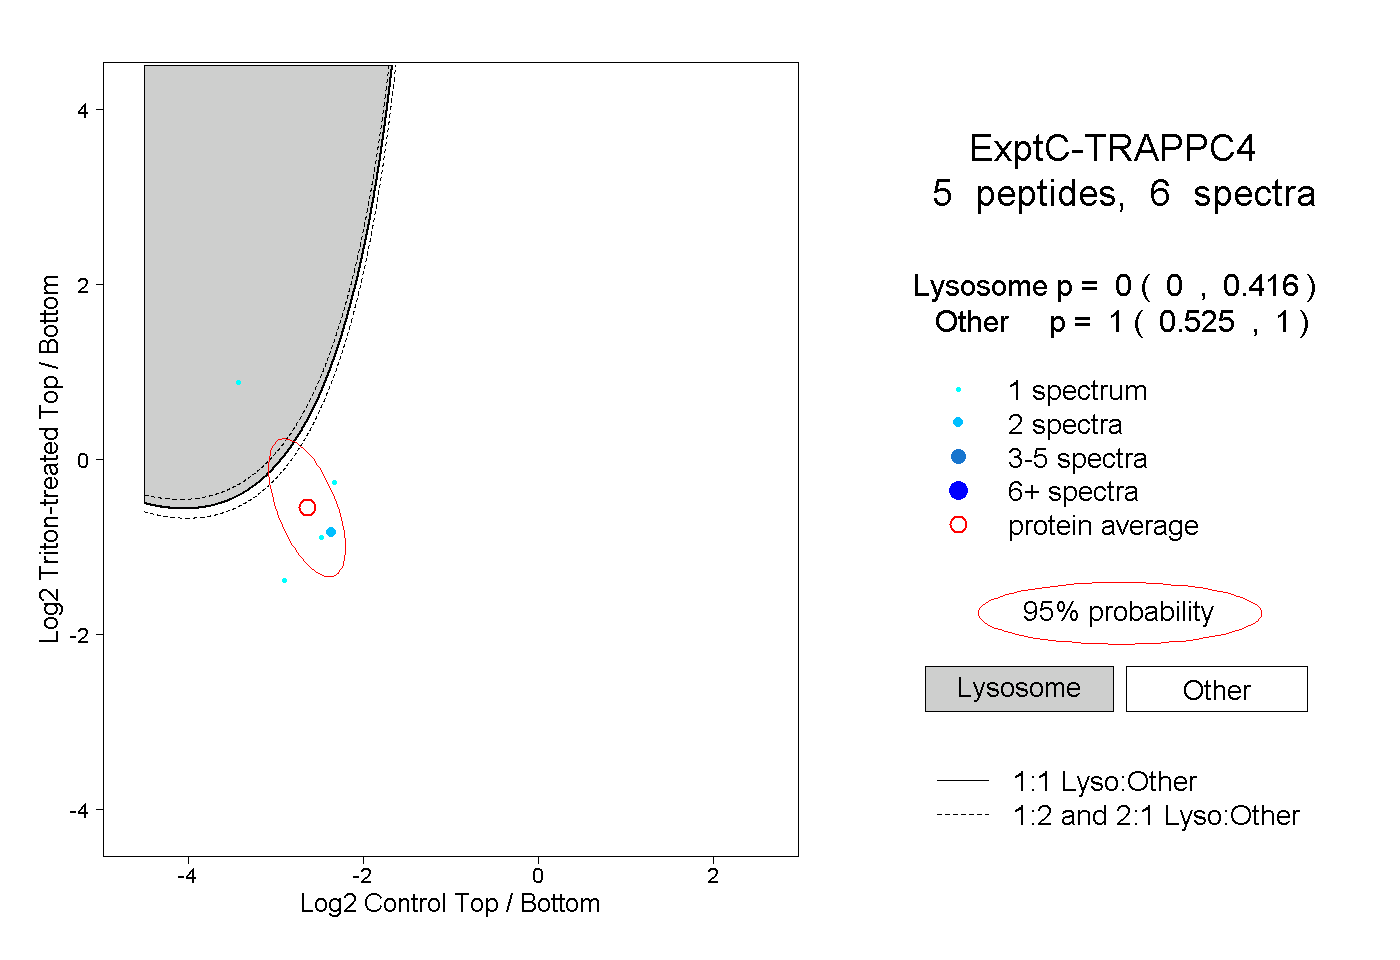
0.000 | 0.416
0.525 | 1.000