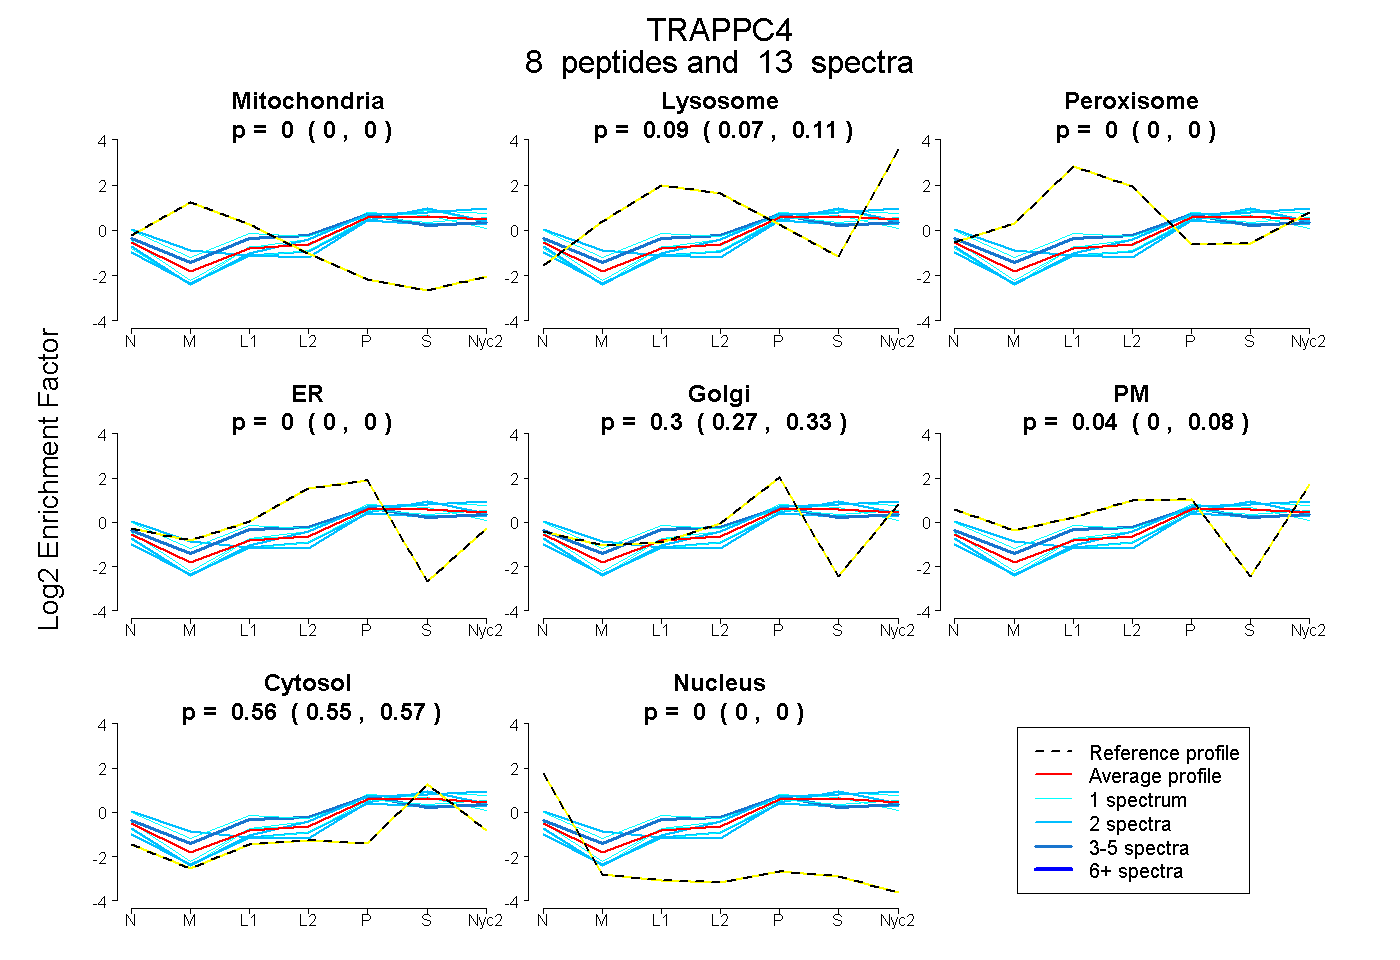
 8
8peptides
spectra
0.000 | 0.000
0.072 | 0.112
0.000 | 0.000
0.000 | 0.000
0.267 | 0.329
0.000 | 0.084
0.550 | 0.572
0.000 | 0.000
| Plot | Mito | Lyso | Perox | ER | Golgi | PM | Cytosol | Nucleus | |||||
| Expt A |
8 peptides |
13 spectra |
|
0.000 0.000 | 0.000 |
0.094 0.072 | 0.112 |
0.000 0.000 | 0.000 |
0.000 0.000 | 0.000 |
0.302 0.267 | 0.329 |
0.043 0.000 | 0.084 |
0.561 0.550 | 0.572 |
0.000 0.000 | 0.000 |
| 3 spectra, LALEVAEK | 0.000 | 0.020 | 0.149 | 0.000 | 0.332 | 0.070 | 0.429 | 0.000 | ||
| 1 spectrum, AIFSVYVVNK | 0.000 | 0.137 | 0.000 | 0.000 | 0.248 | 0.000 | 0.616 | 0.000 | ||
| 2 spectra, AGTFGPGS | 0.000 | 0.000 | 0.000 | 0.000 | 0.190 | 0.282 | 0.528 | 0.000 | ||
| 2 spectra, NPFYSLEMPIR | 0.000 | 0.038 | 0.000 | 0.000 | 0.279 | 0.000 | 0.683 | 0.000 | ||
| 1 spectrum, FVVLADPR | 0.000 | 0.042 | 0.000 | 0.000 | 0.292 | 0.000 | 0.666 | 0.000 | ||
| 1 spectrum, CELFDQNLK | 0.000 | 0.000 | 0.067 | 0.000 | 0.381 | 0.000 | 0.553 | 0.000 | ||
| 2 spectra, VLVAFGQR | 0.000 | 0.127 | 0.000 | 0.000 | 0.303 | 0.000 | 0.570 | 0.000 | ||
| 1 spectrum, TFSYPLDLLLK | 0.000 | 0.008 | 0.121 | 0.000 | 0.109 | 0.315 | 0.446 | 0.000 |
| Plot | Mito | Lyso or Perox | ER | Golgi | PM | Cytosol | Nucleus | ||||||
| Expt B |
3 peptides |
7 spectra |
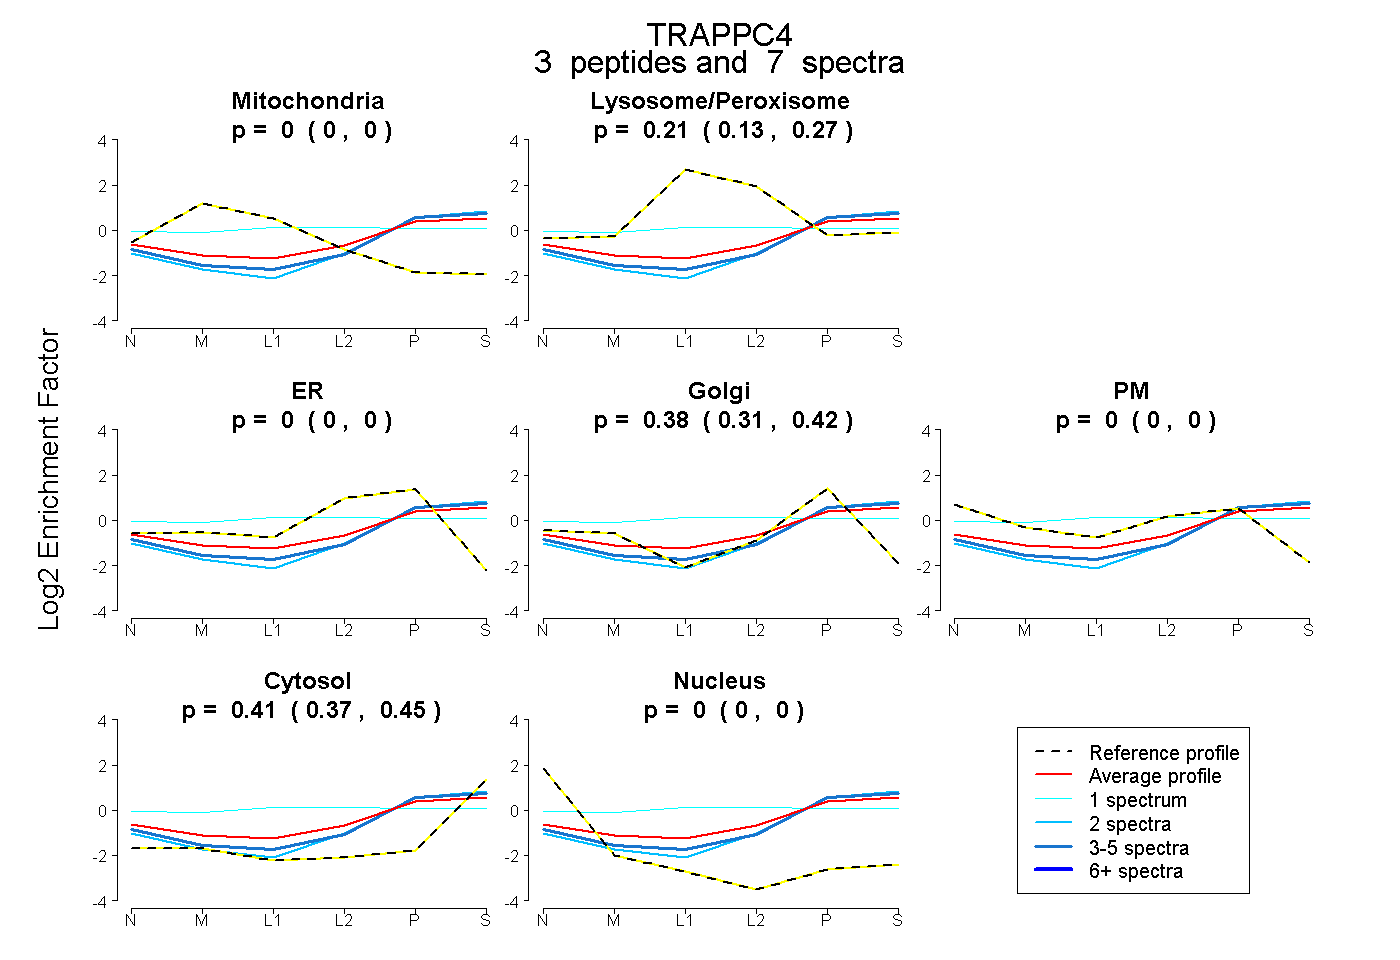 |
0.000 0.000 | 0.000 |
0.211 0.126 | 0.273 |
0.000 0.000 | 0.004 |
0.377 0.307 | 0.424 |
0.000 0.000 | 0.000 |
0.411 0.366 | 0.453 |
0.000 0.000 | 0.000 |
|||
| Plot | Lyso | Other | |||||||||||
| Expt C |
5 peptides |
6 spectra |
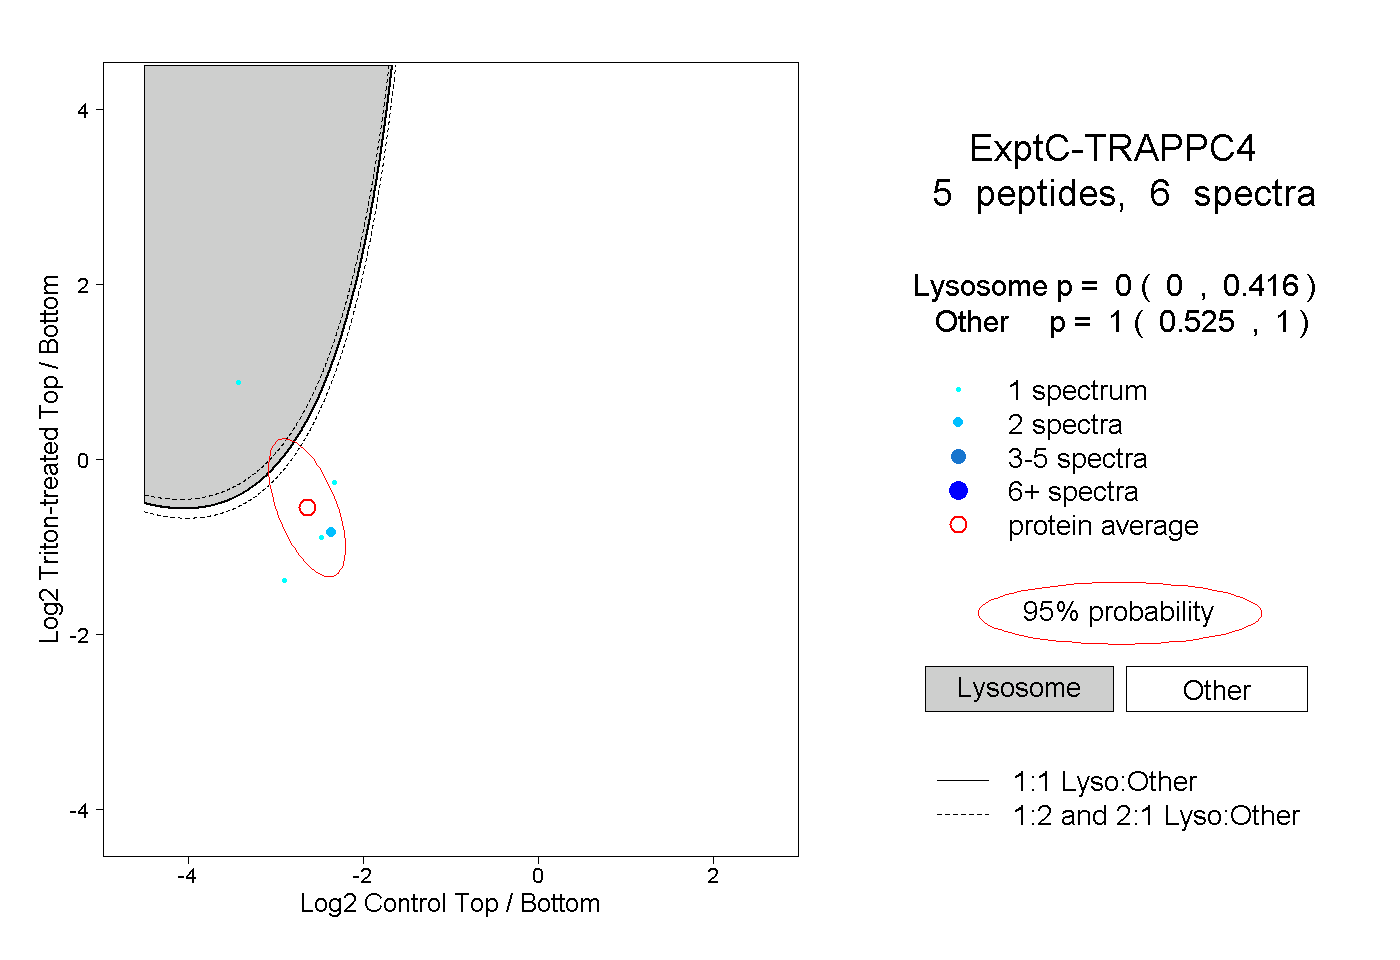 |
0.000 0.000 | 0.416 |
1.000 0.525 | 1.000 |