 9
9peptides
spectra
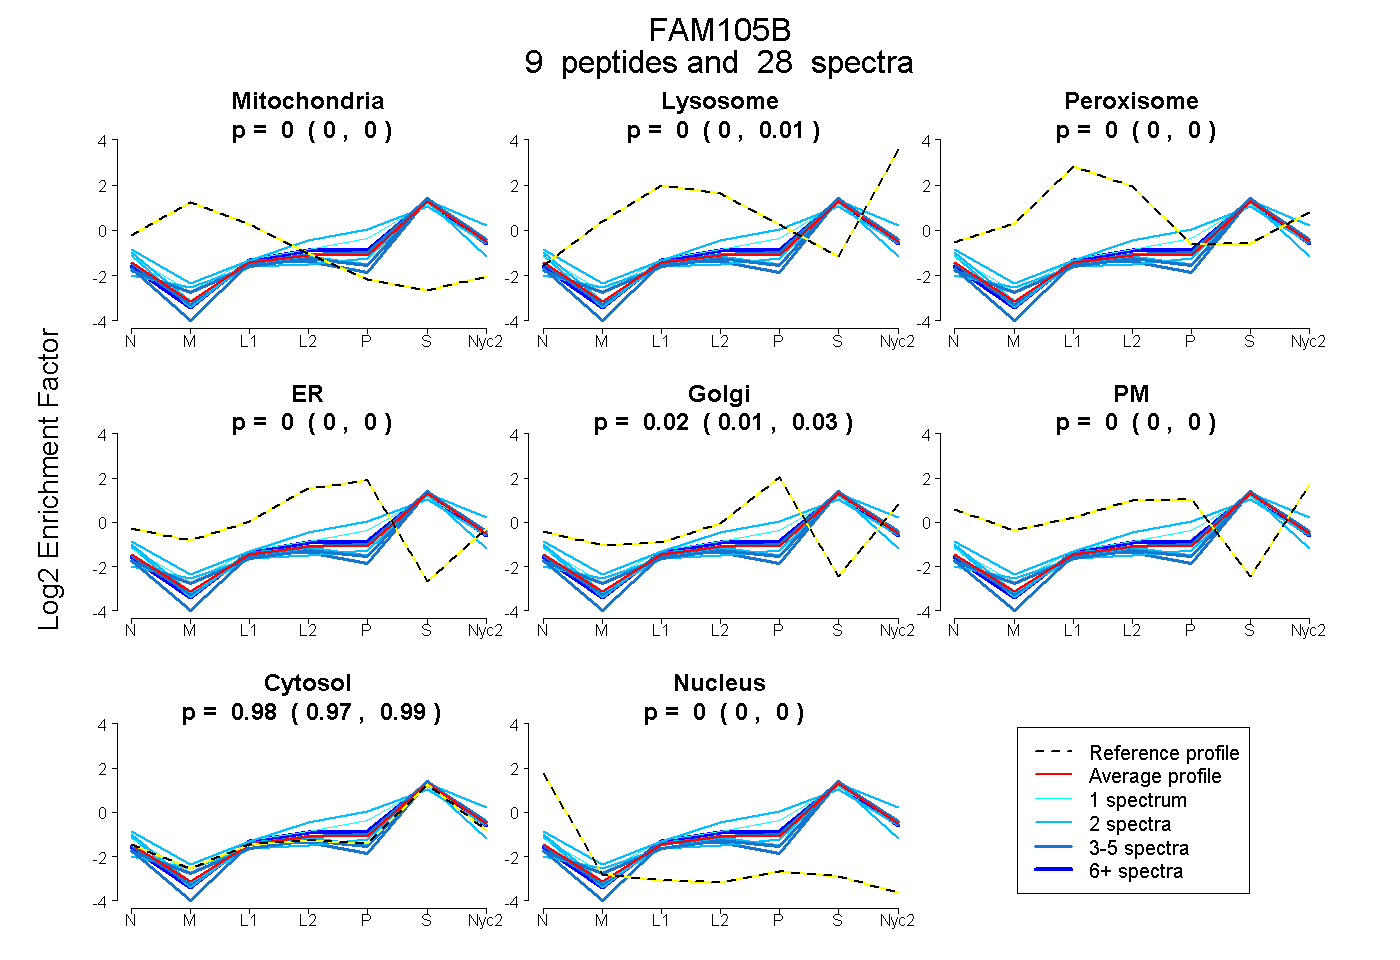
0.000 | 0.000
0.000 | 0.005
0.000 | 0.000
0.000 | 0.000
0.009 | 0.028
0.000 | 0.000
0.971 | 0.987
0.000 | 0.000
5peptides
spectra
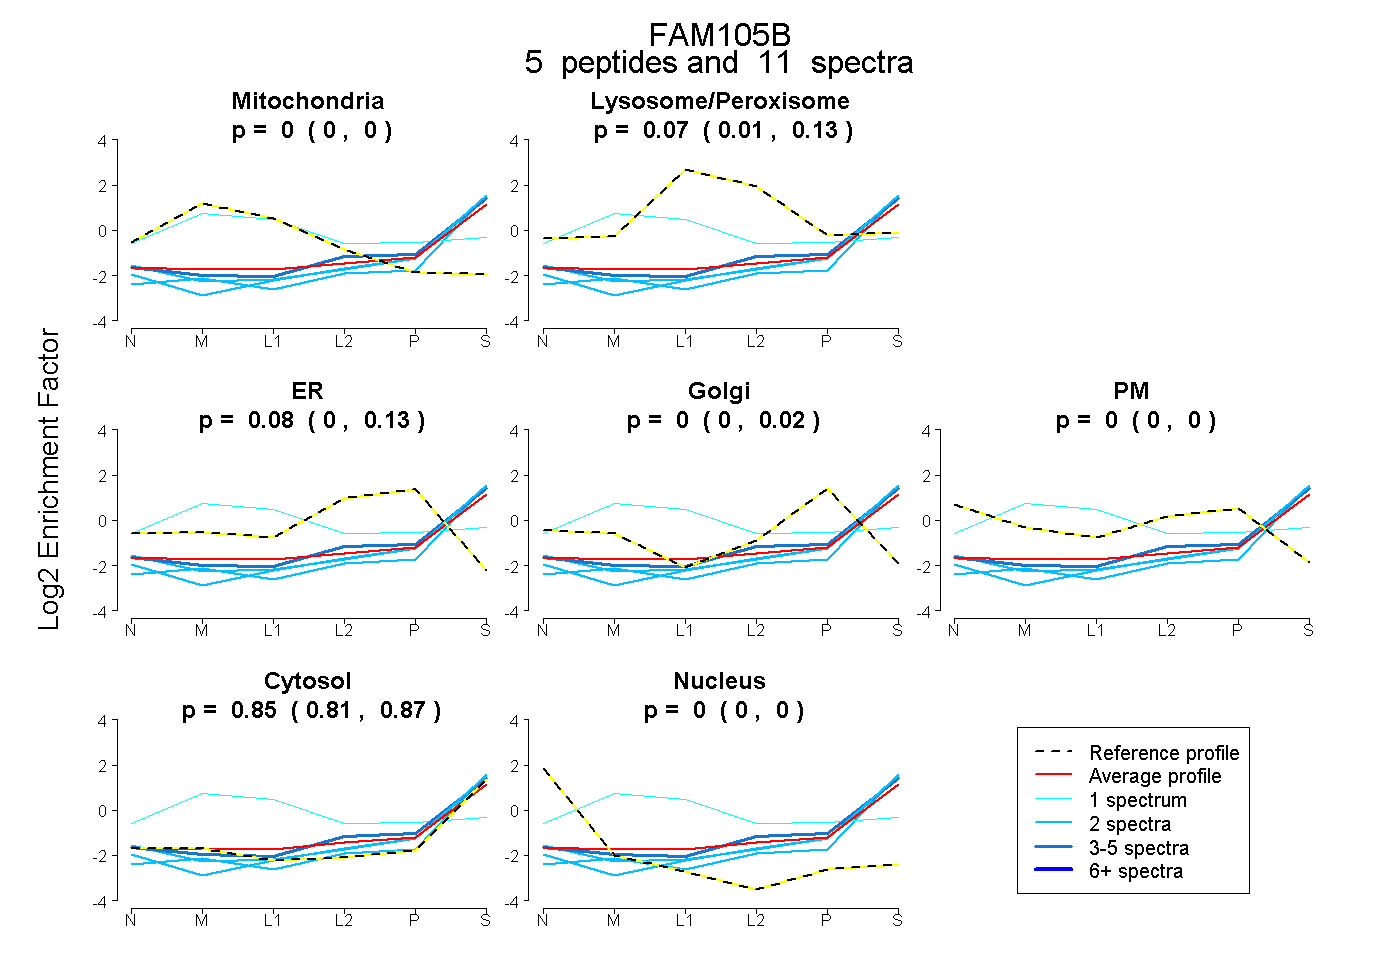
0.000 | 0.000
0.008 | 0.127
0.000 | 0.126
0.000 | 0.023
0.000 | 0.000
0.810 | 0.875
0.000 | 0.000
6peptides
spectra
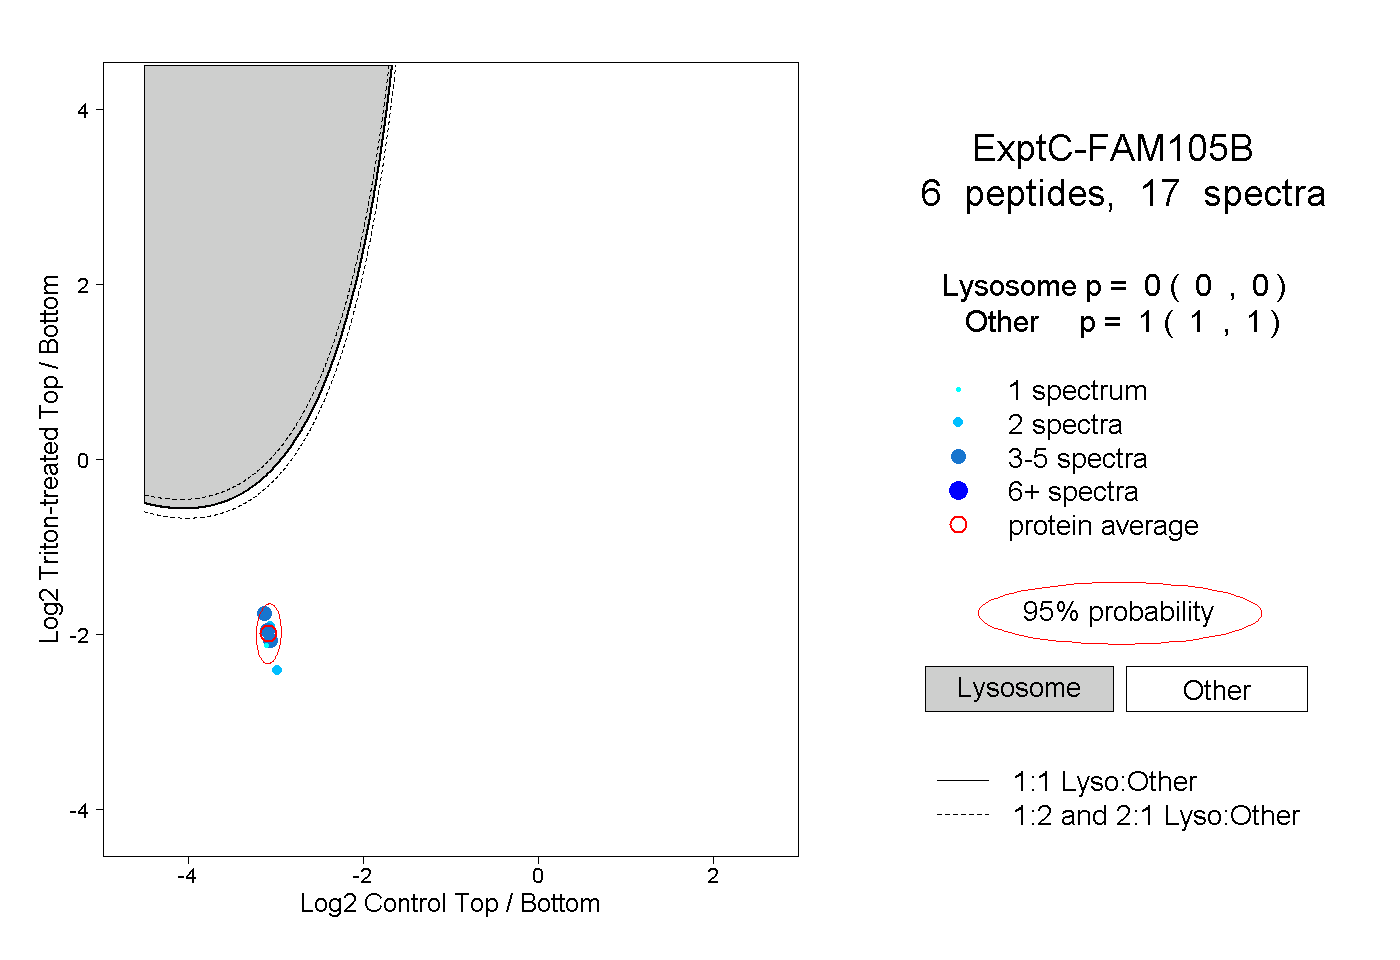
0.000 | 0.000
1.000 | 1.000
2peptides
spectra
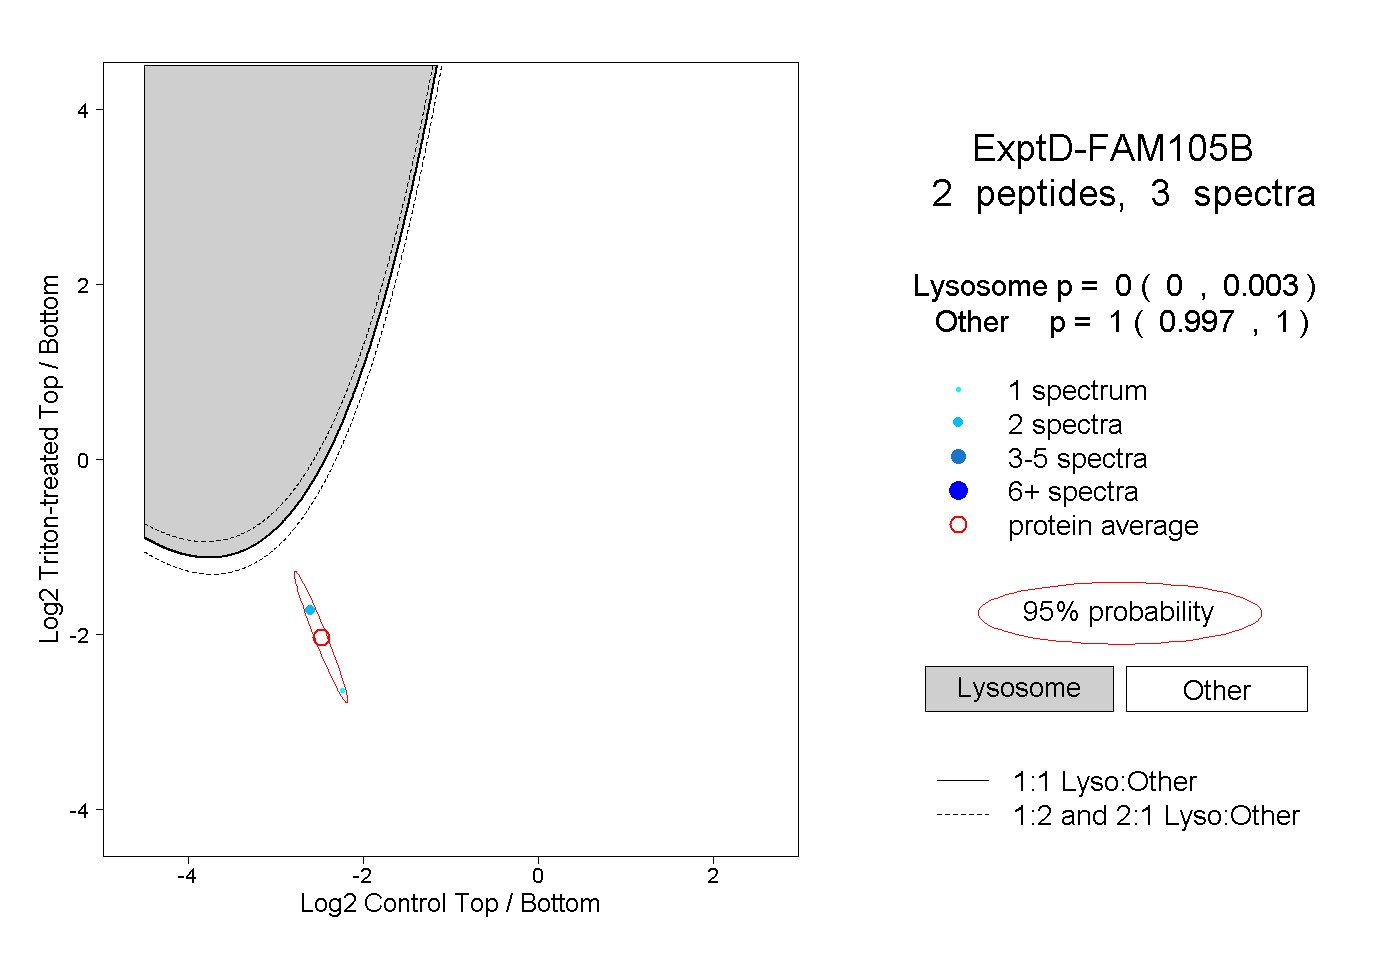
0.000 | 0.003
0.997 | 1.000