 9
9peptides
spectra
0.000 | 0.000
0.000 | 0.005
0.000 | 0.000
0.000 | 0.000
0.009 | 0.028
0.000 | 0.000
0.971 | 0.987
0.000 | 0.000
| Plot | Mito | Lyso | Perox | ER | Golgi | PM | Cytosol | Nucleus | |||||
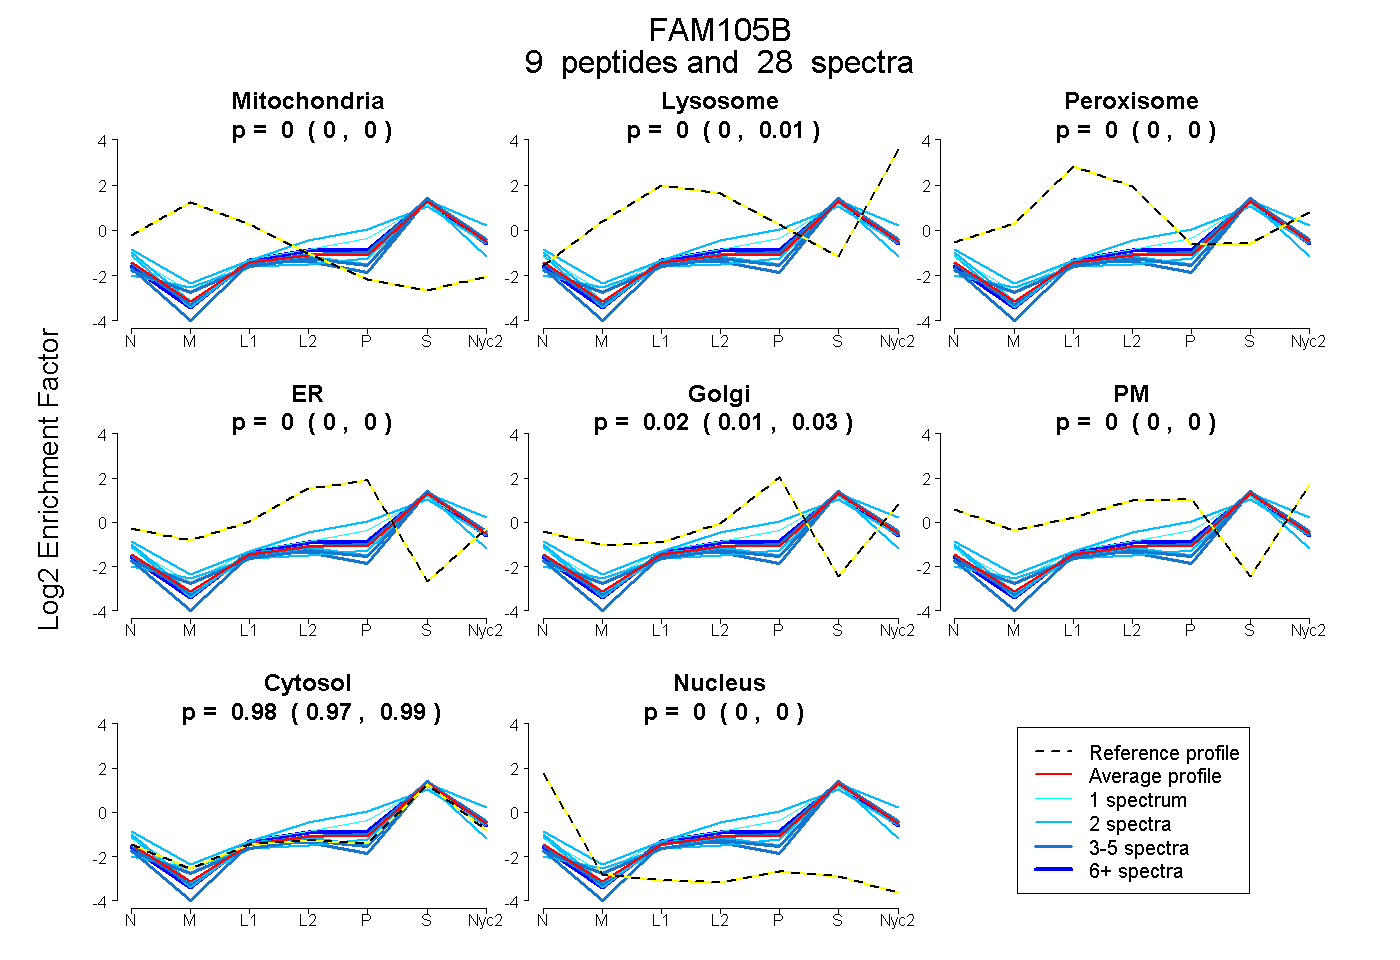
| Expt A |
9 peptides |
28 spectra |
|
0.000 0.000 | 0.000 |
0.000 0.000 | 0.005 |
0.000 0.000 | 0.000 |
0.000 0.000 | 0.000 |
0.021 0.009 | 0.028 |
0.000 0.000 | 0.000 |
0.979 0.971 | 0.987 |
0.000 0.000 | 0.000 |
| 2 spectra, LSVAPEMDIMDYCK | 0.000 | 0.000 | 0.000 | 0.000 | 0.000 | 0.000 | 0.931 | 0.069 | ||
| 8 spectra, CPAEHEEDMYR | 0.000 | 0.000 | 0.000 | 0.019 | 0.008 | 0.000 | 0.973 | 0.000 | ||
| 2 spectra, FLMLAR | 0.000 | 0.022 | 0.000 | 0.000 | 0.000 | 0.000 | 0.978 | 0.000 | ||
| 4 spectra, ELLIHER | 0.000 | 0.000 | 0.000 | 0.000 | 0.000 | 0.000 | 1.000 | 0.000 | ||
| 2 spectra, GDNYCALR | 0.000 | 0.000 | 0.000 | 0.167 | 0.066 | 0.000 | 0.766 | 0.000 | ||
| 3 spectra, VTVGAQPR | 0.000 | 0.000 | 0.000 | 0.000 | 0.000 | 0.000 | 1.000 | 0.000 | ||
| 2 spectra, DTSNDPEQLLR | 0.000 | 0.041 | 0.000 | 0.000 | 0.000 | 0.000 | 0.959 | 0.000 | ||
| 4 spectra, SEDLVER | 0.000 | 0.004 | 0.000 | 0.000 | 0.000 | 0.000 | 0.996 | 0.000 | ||
| 1 spectrum, EAGAAAR | 0.000 | 0.004 | 0.000 | 0.008 | 0.139 | 0.000 | 0.848 | 0.000 |
| Plot | Mito | Lyso or Perox | ER | Golgi | PM | Cytosol | Nucleus | ||||||
| Expt B |
5 peptides |
11 spectra |
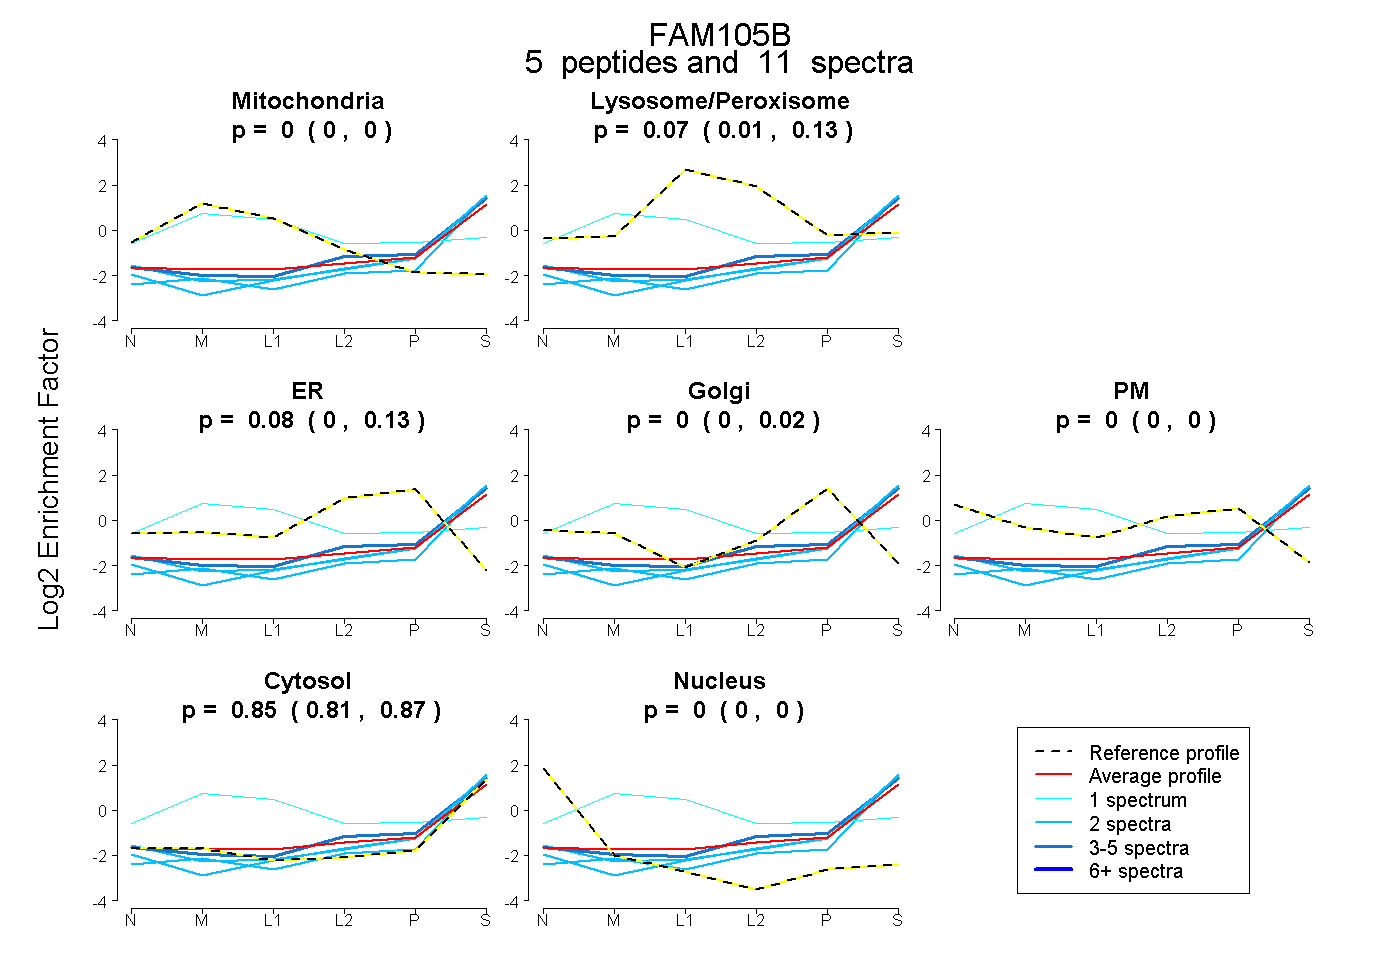 |
0.000 0.000 | 0.000 |
0.072 0.008 | 0.127 |
0.080 0.000 | 0.126 |
0.000 0.000 | 0.023 |
0.000 0.000 | 0.000 |
0.848 0.810 | 0.875 |
0.000 0.000 | 0.000 |
|||
| Plot | Lyso | Other | |||||||||||
| Expt C |
6 peptides |
17 spectra |
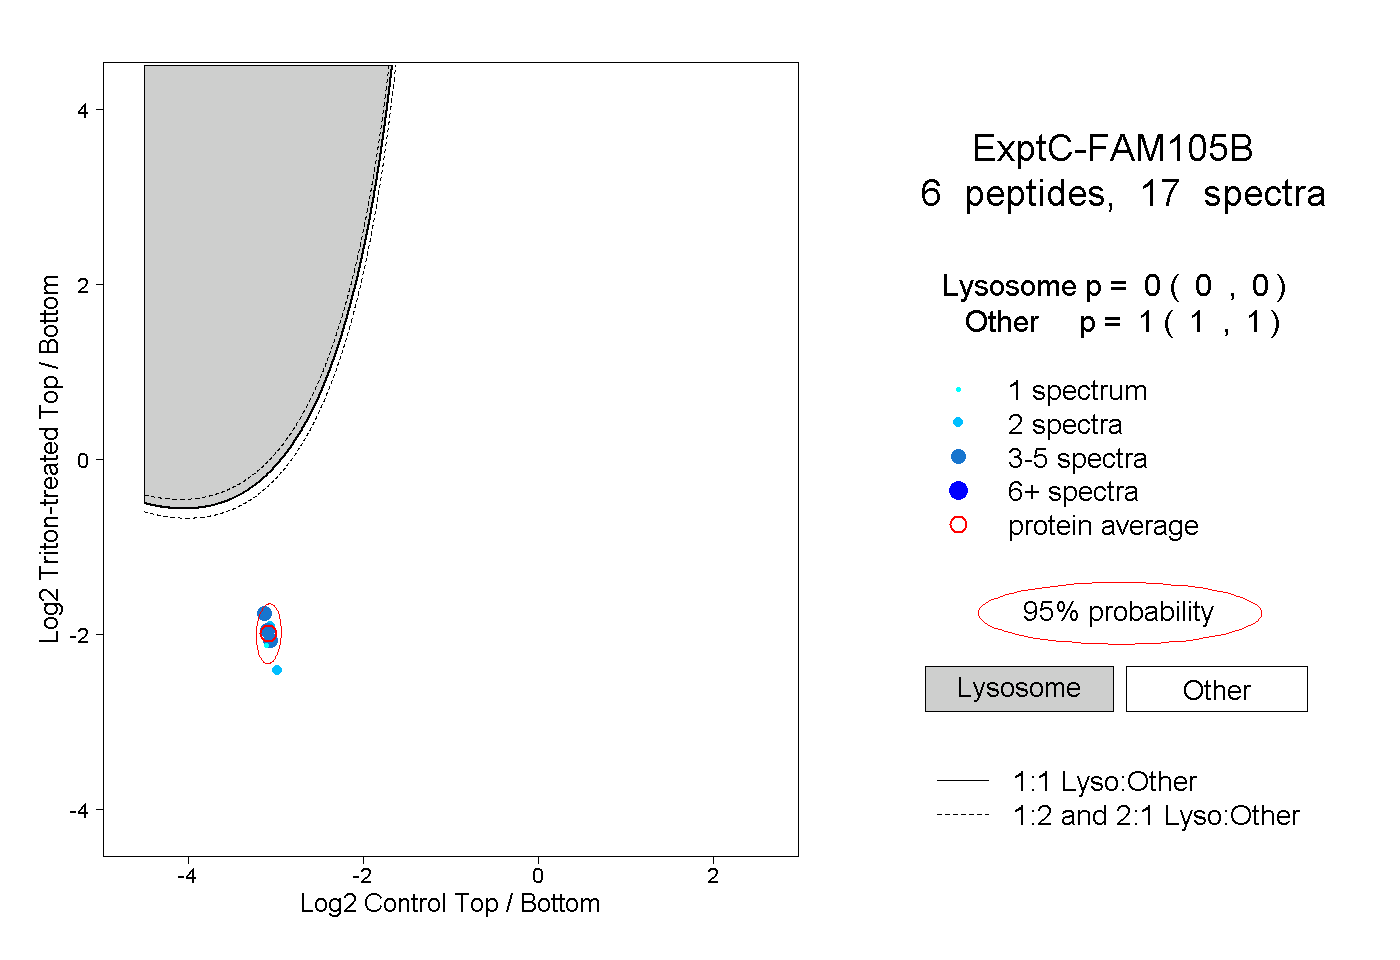 |
0.000 0.000 | 0.000 |
1.000 1.000 | 1.000 |
||||||||
| Plot | Lyso | Other | |||||||||||
| Expt D |
2 peptides |
3 spectra |
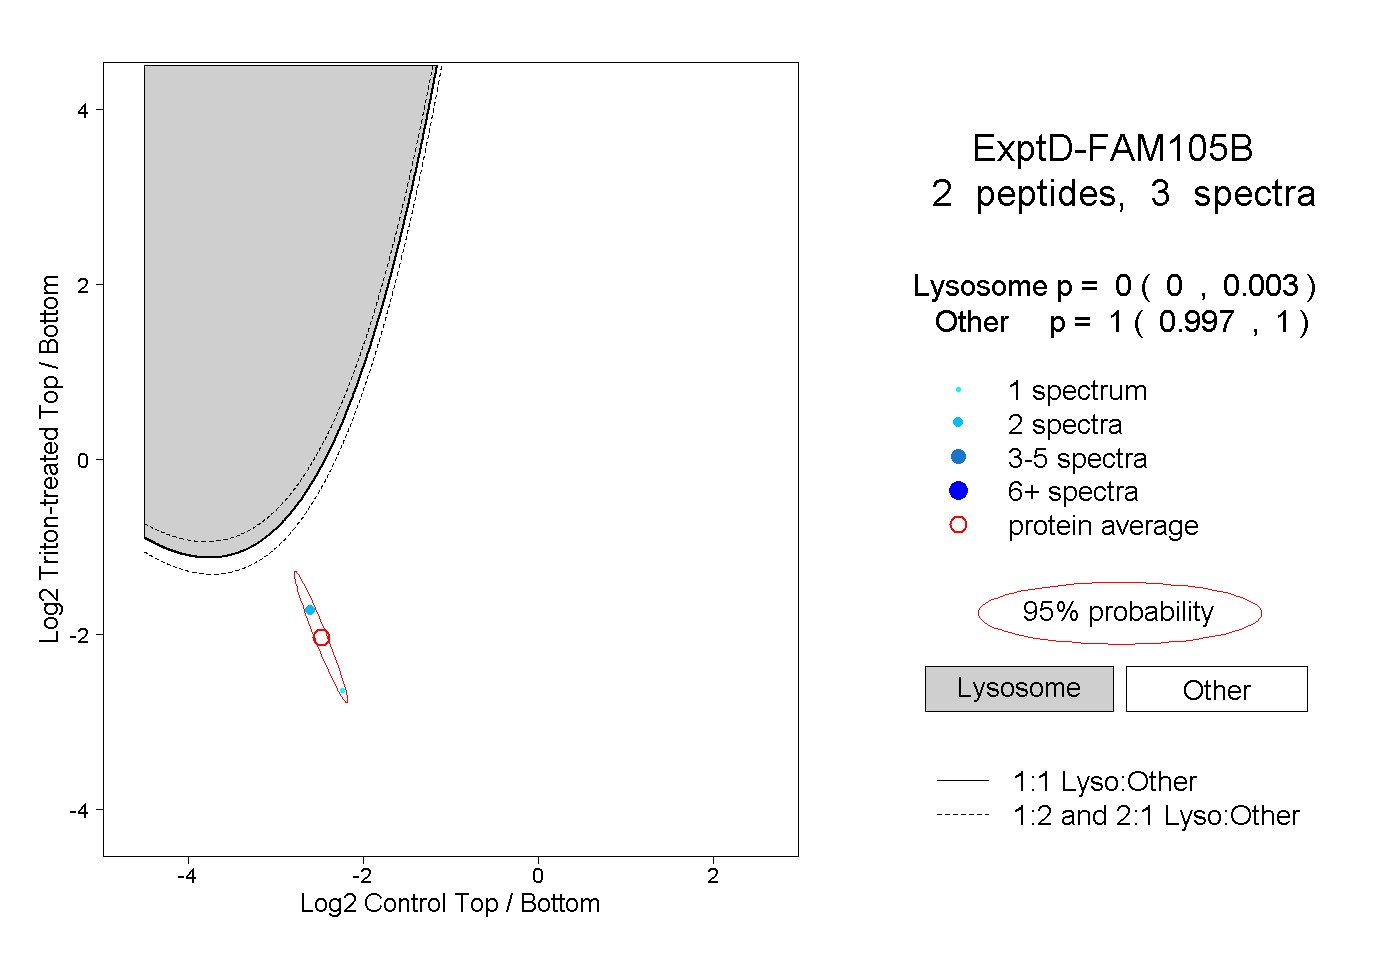 |
0.000 0.000 | 0.003 |
1.000 0.997 | 1.000 |