 2
2peptides
spectra
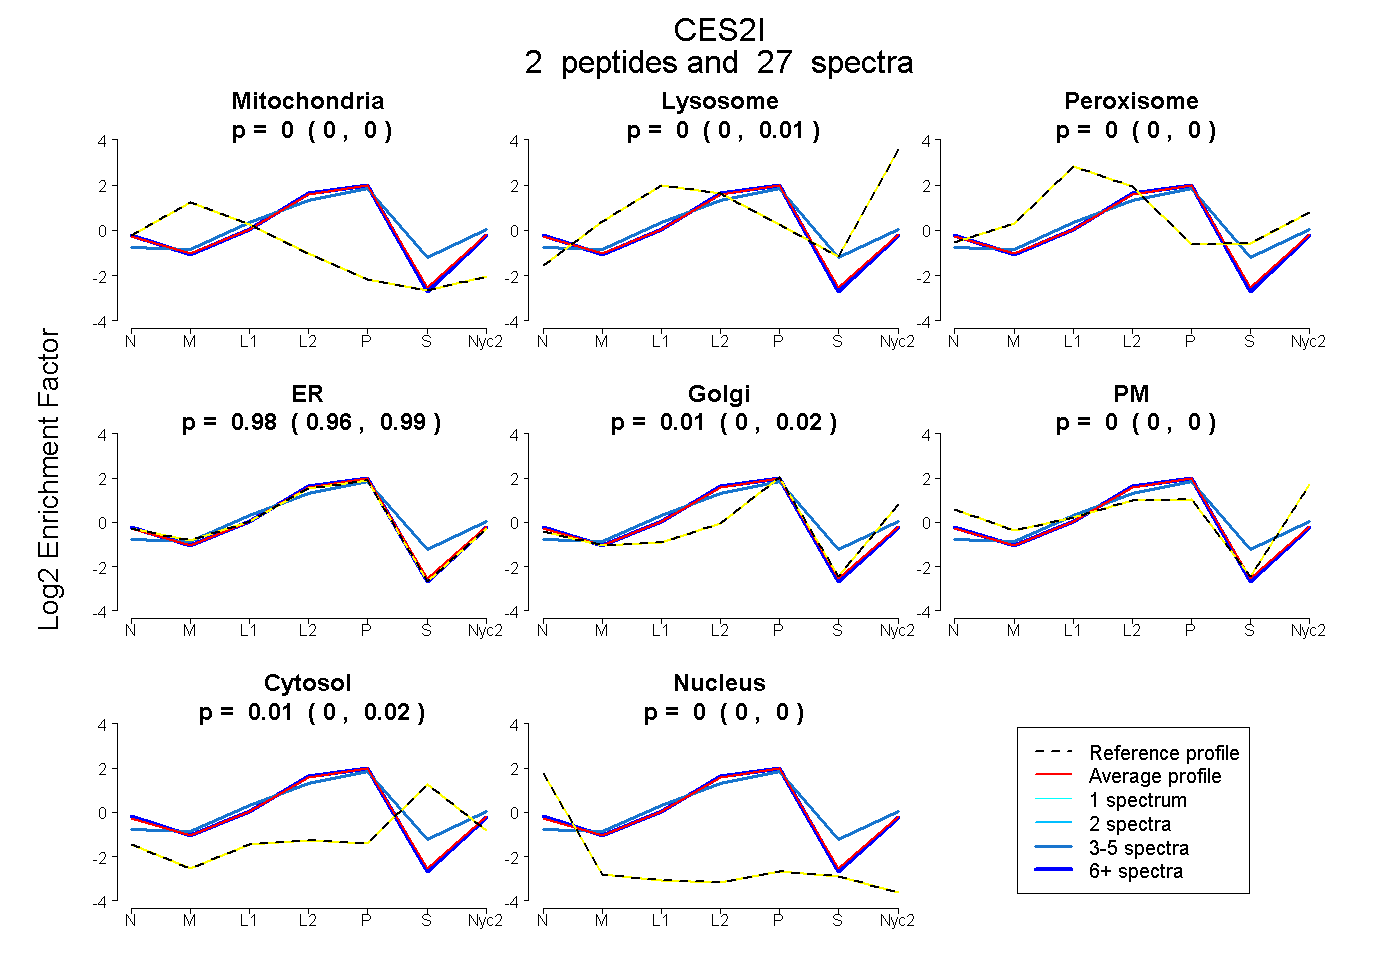
0.000 | 0.000
0.000 | 0.008
0.000 | 0.000
0.964 | 0.986
0.000 | 0.023
0.000 | 0.000
0.000 | 0.017
0.000 | 0.000
2peptides
spectra
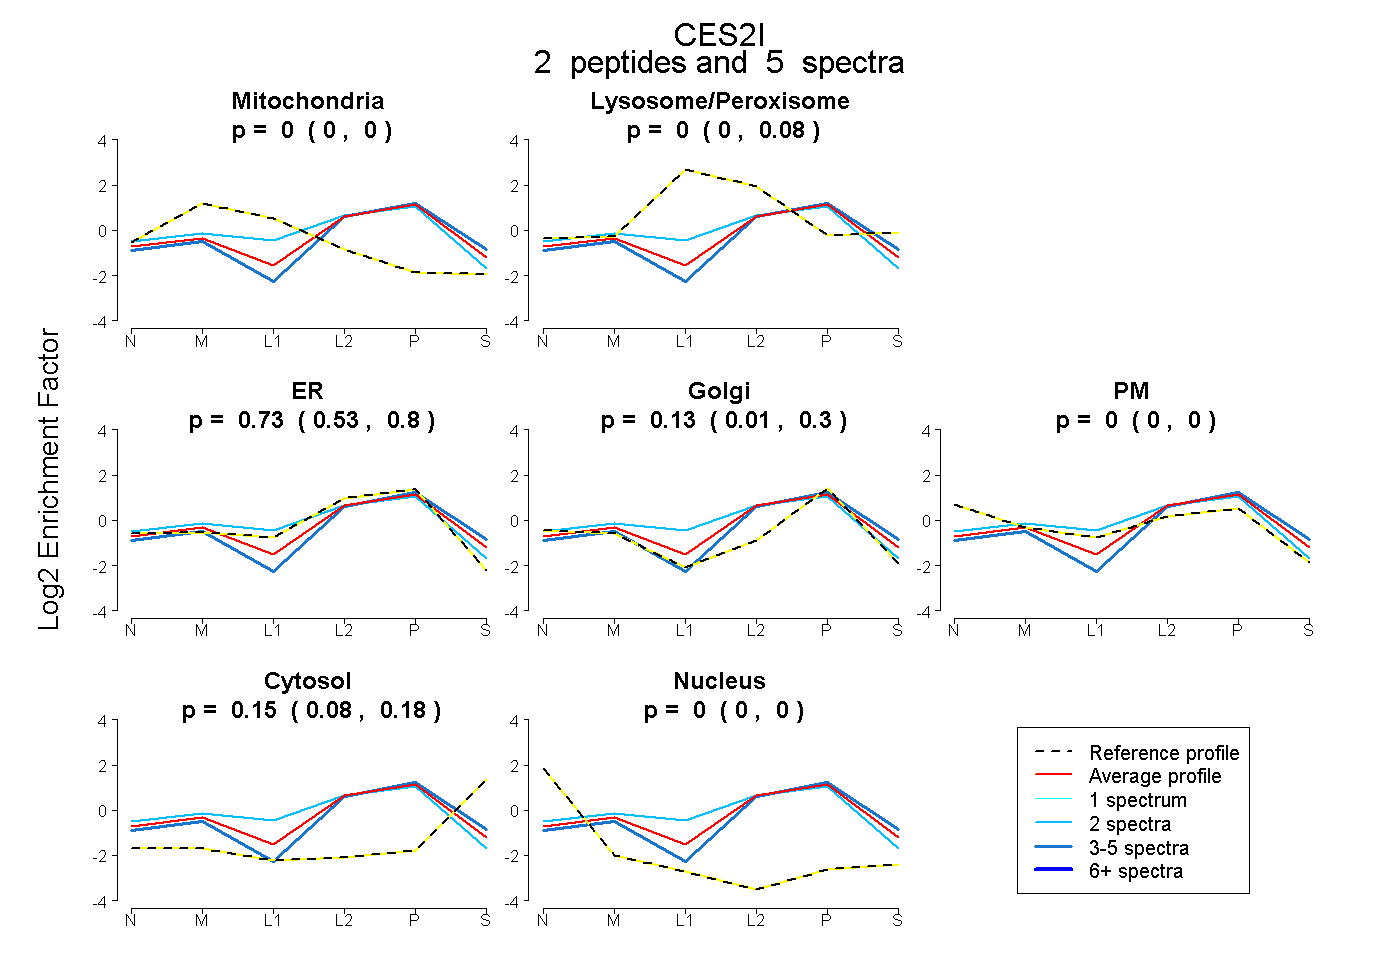
0.000 | 0.000
0.000 | 0.084
0.528 | 0.802
0.007 | 0.304
0.000 | 0.000
0.083 | 0.181
0.000 | 0.000
2peptides
spectra
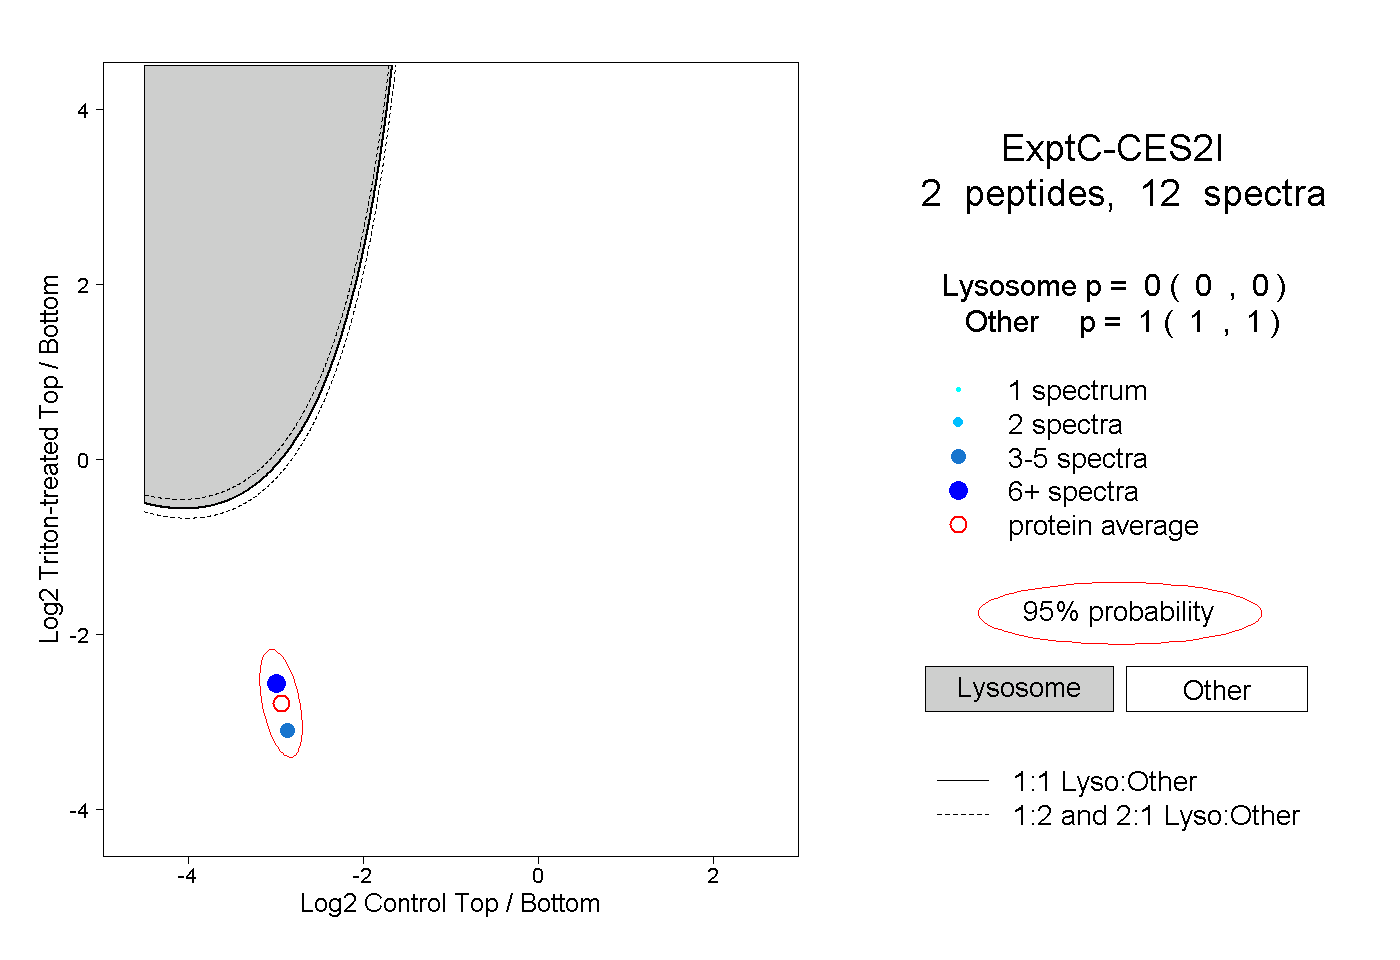
0.000 | 0.000
1.000 | 1.000
1peptide
spectrum
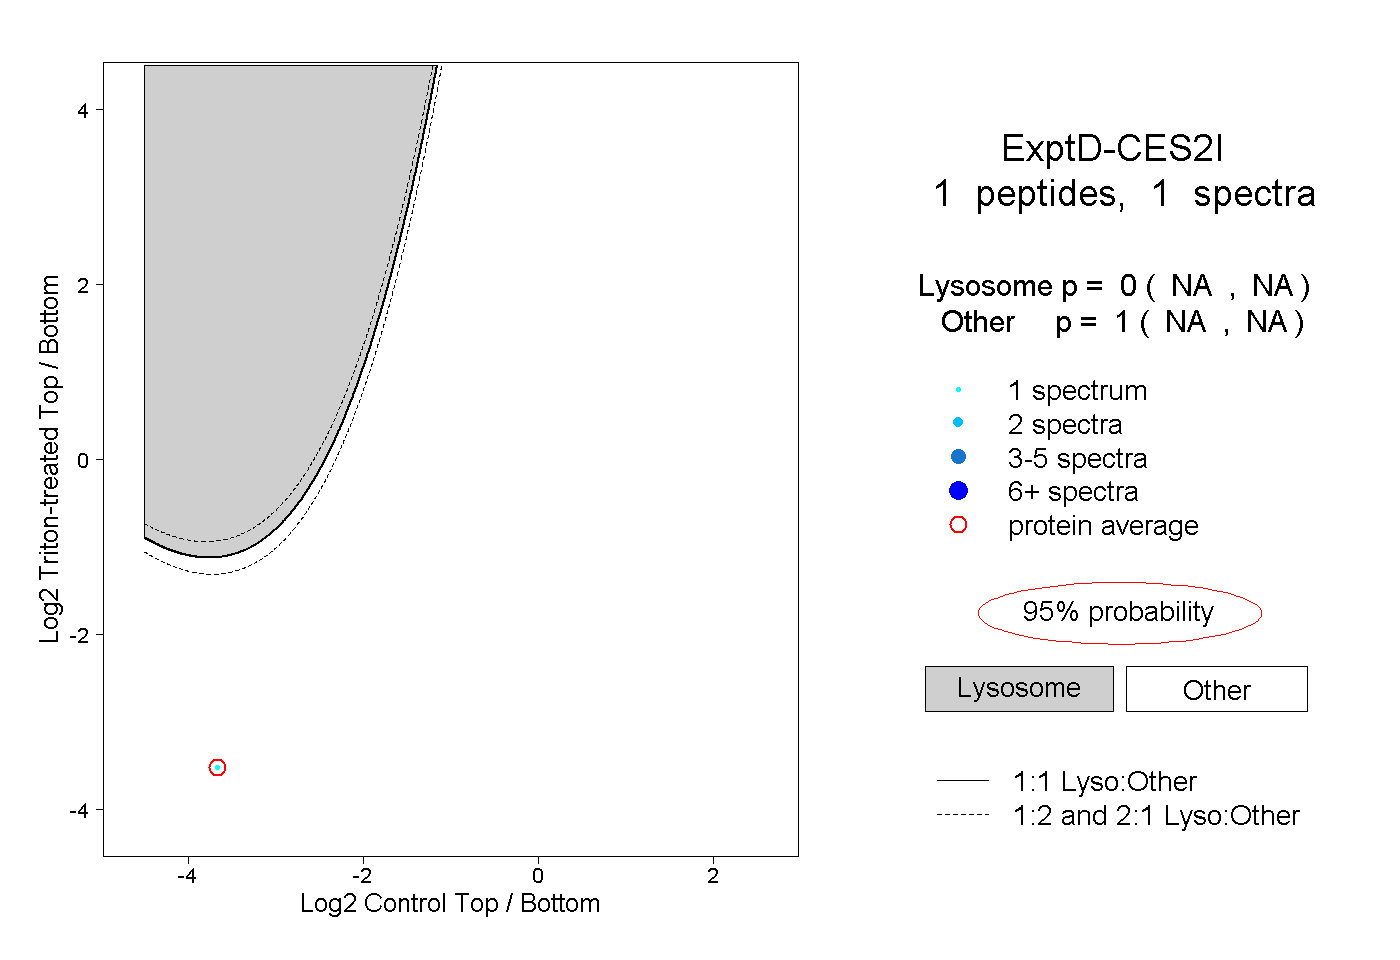
NA | NA
NA | NA