 2
2peptides
spectra
0.000 | 0.000
0.000 | 0.008
0.000 | 0.000
0.964 | 0.986
0.000 | 0.023
0.000 | 0.000
0.000 | 0.017
0.000 | 0.000
| Plot | Mito | Lyso | Perox | ER | Golgi | PM | Cytosol | Nucleus | |||||
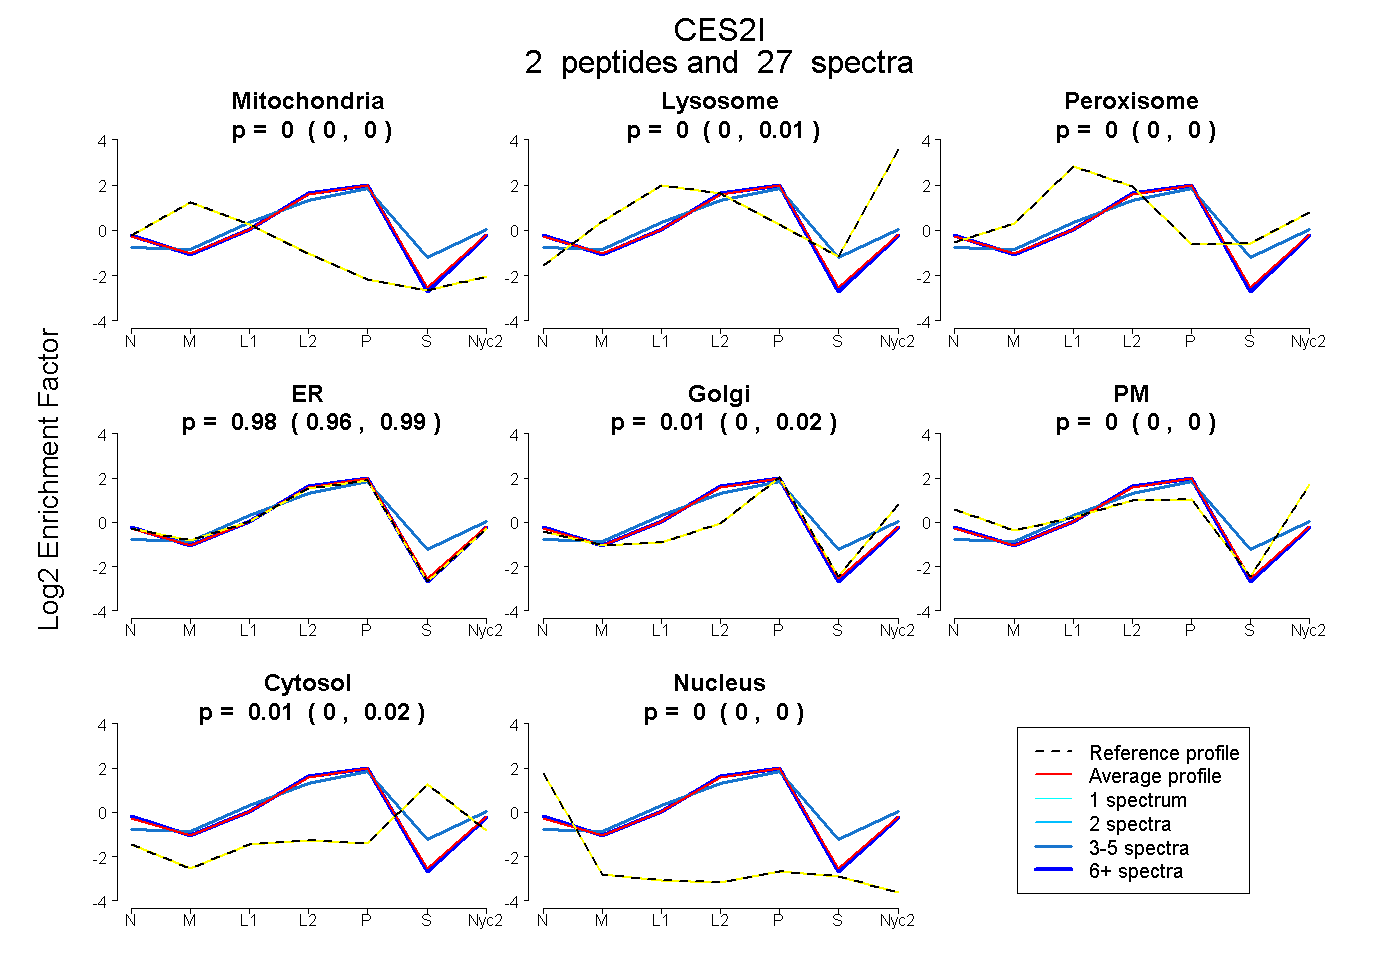
| Expt A |
2 peptides |
27 spectra |
|
0.000 0.000 | 0.000 |
0.002 0.000 | 0.008 |
0.000 0.000 | 0.000 |
0.977 0.964 | 0.986 |
0.011 0.000 | 0.023 |
0.000 0.000 | 0.000 |
0.009 0.000 | 0.017 |
0.000 0.000 | 0.000 |
| 3 spectra, SQAPVYFYEFQHLPSFIK | 0.000 | 0.118 | 0.040 | 0.708 | 0.000 | 0.000 | 0.135 | 0.000 | ||
| 24 spectra, QVRPSHVK | 0.000 | 0.000 | 0.000 | 0.996 | 0.004 | 0.000 | 0.000 | 0.000 |
| Plot | Mito | Lyso or Perox | ER | Golgi | PM | Cytosol | Nucleus | ||||||
| Expt B |
2 peptides |
5 spectra |
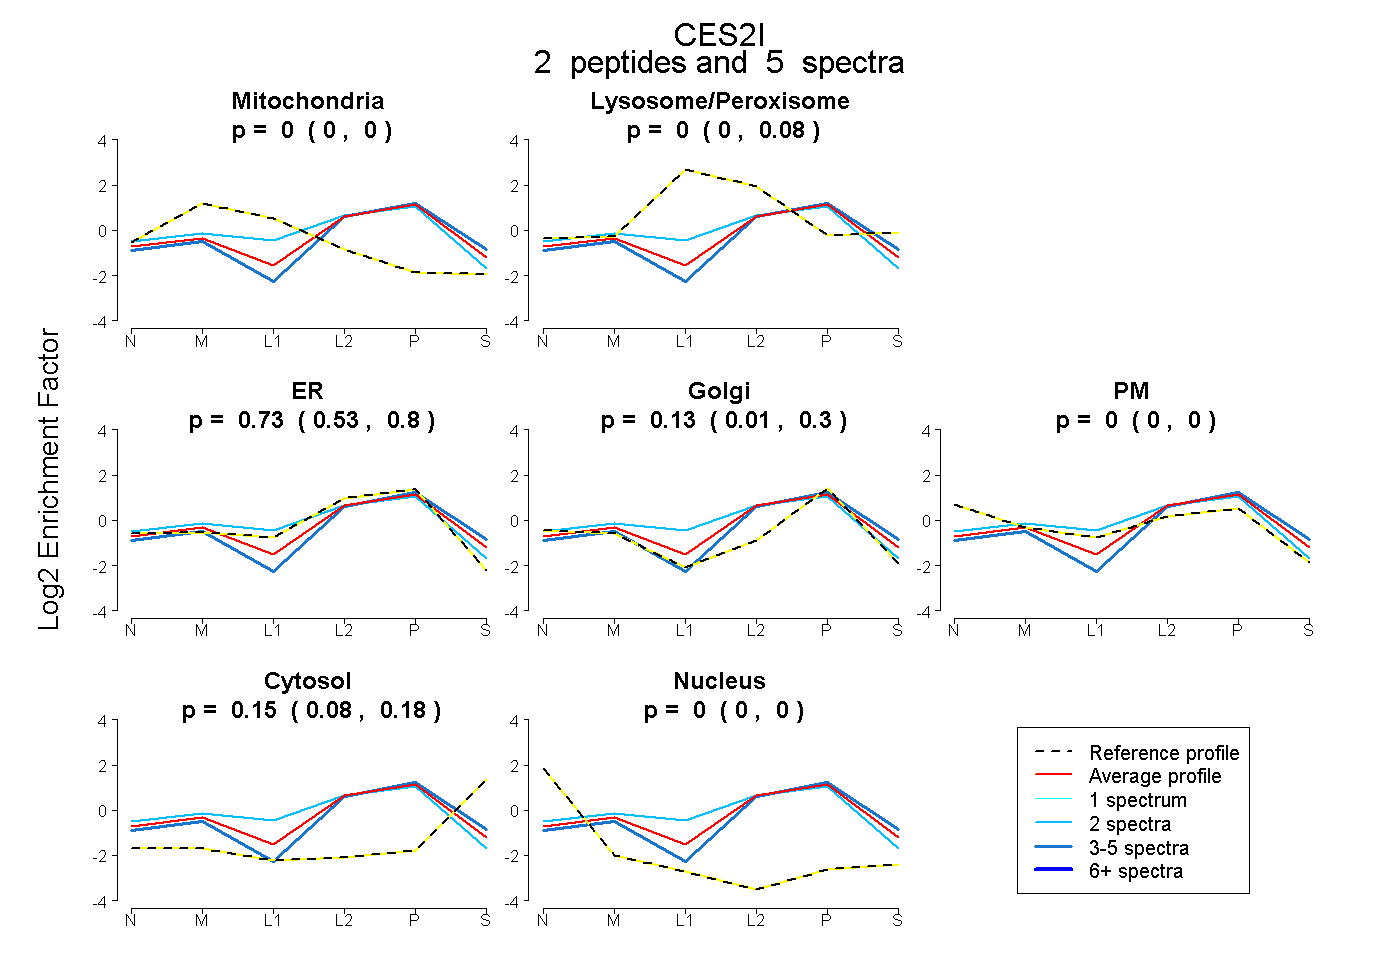 |
0.000 0.000 | 0.000 |
0.000 0.000 | 0.084 |
0.726 0.528 | 0.802 |
0.129 0.007 | 0.304 |
0.000 0.000 | 0.000 |
0.146 0.083 | 0.181 |
0.000 0.000 | 0.000 |
|||
| Plot | Lyso | Other | |||||||||||
| Expt C |
2 peptides |
12 spectra |
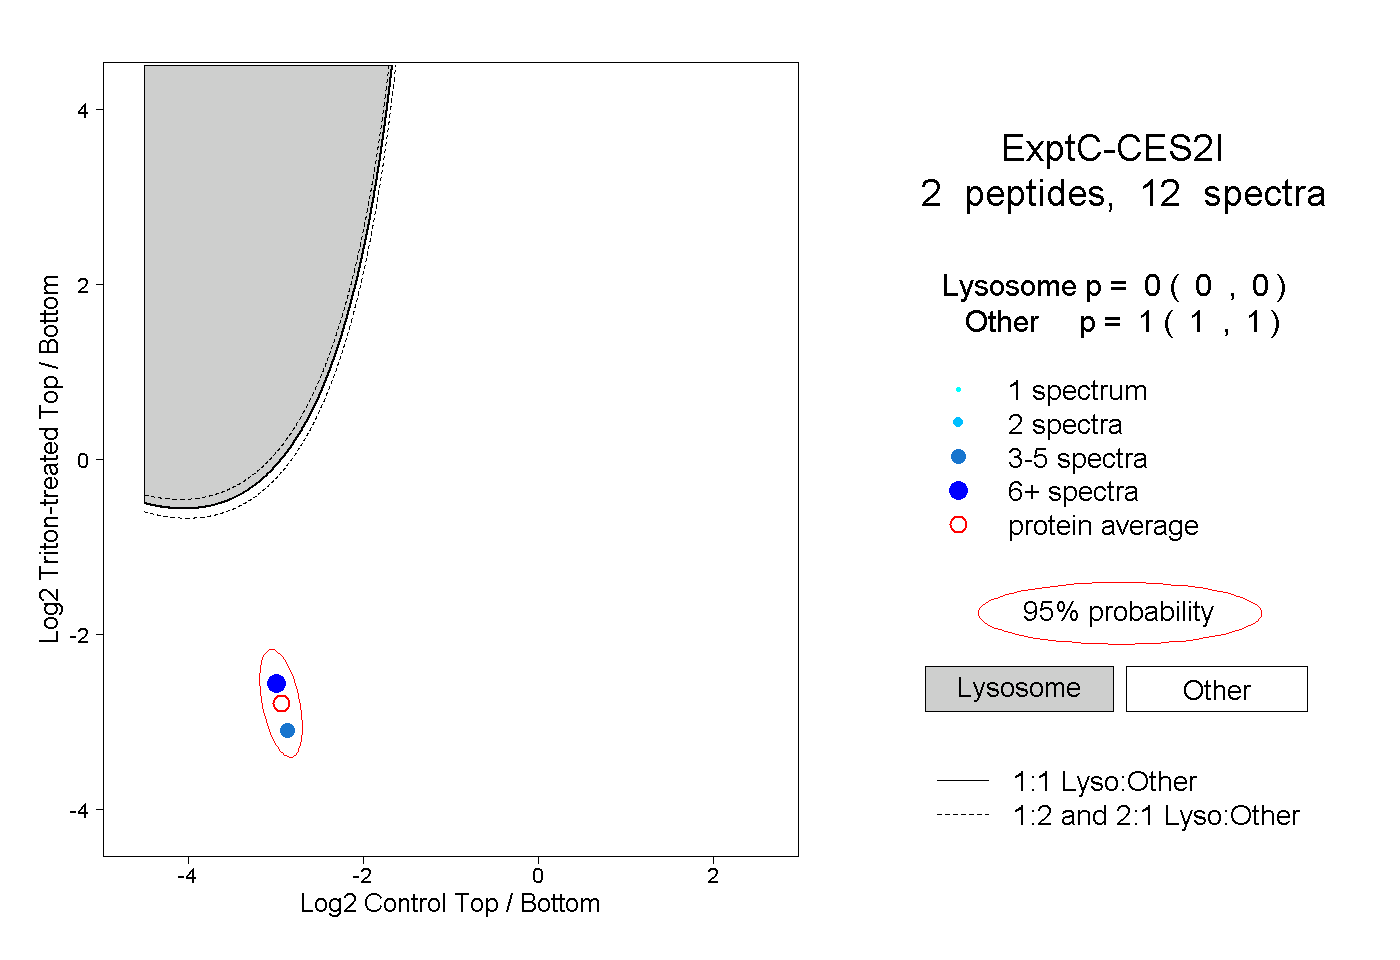 |
0.000 0.000 | 0.000 |
1.000 1.000 | 1.000 |
||||||||
| Plot | Lyso | Other | |||||||||||
| Expt D |
1 peptide |
1 spectrum |
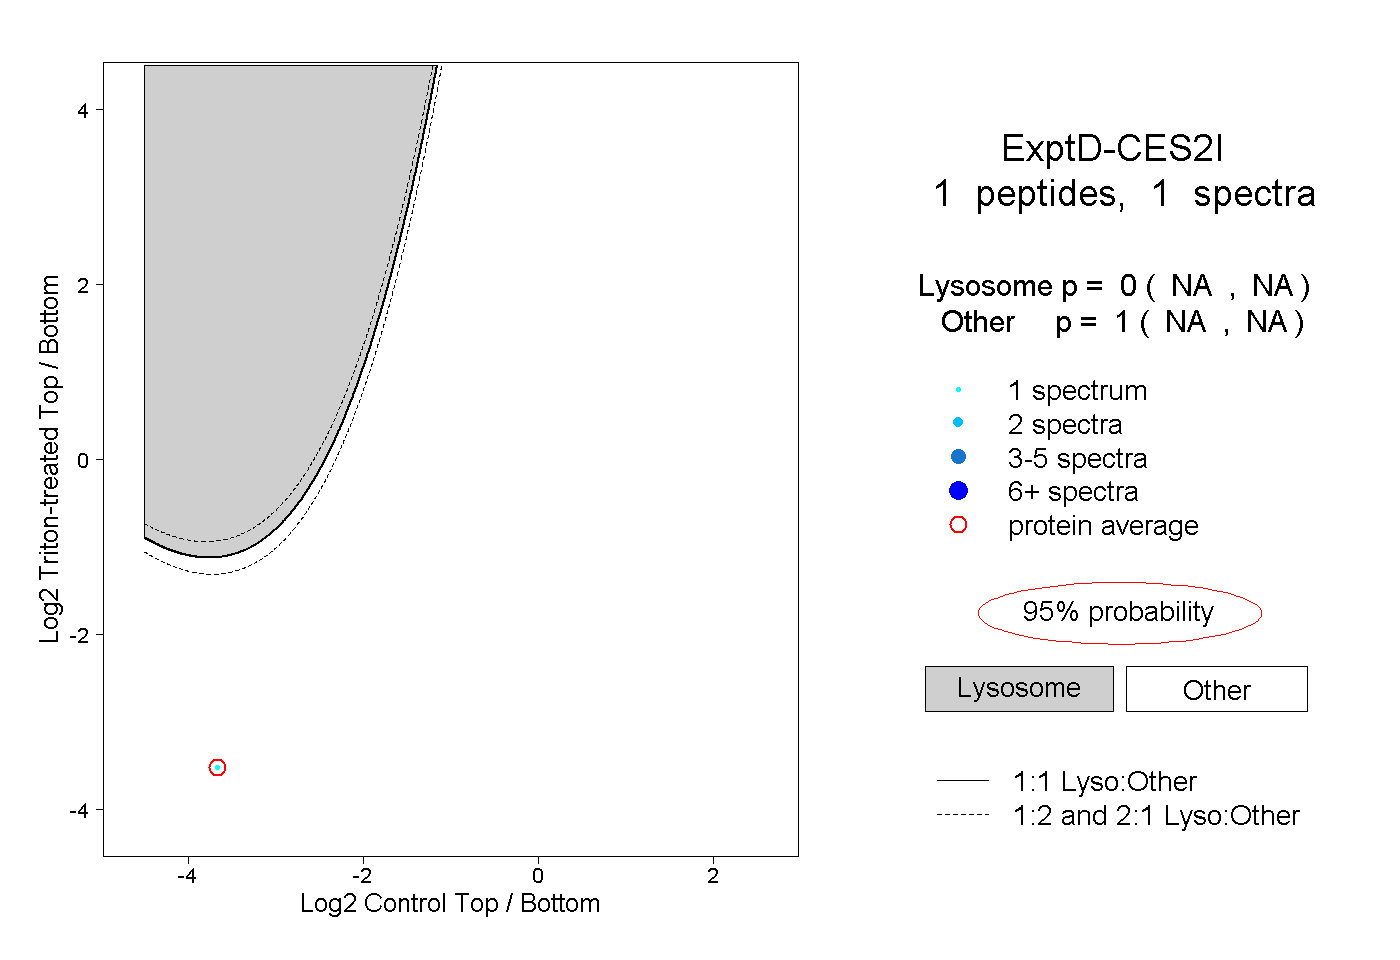 |
0.000 NA | NA |
1.000 NA | NA |