 4
4peptides
spectra
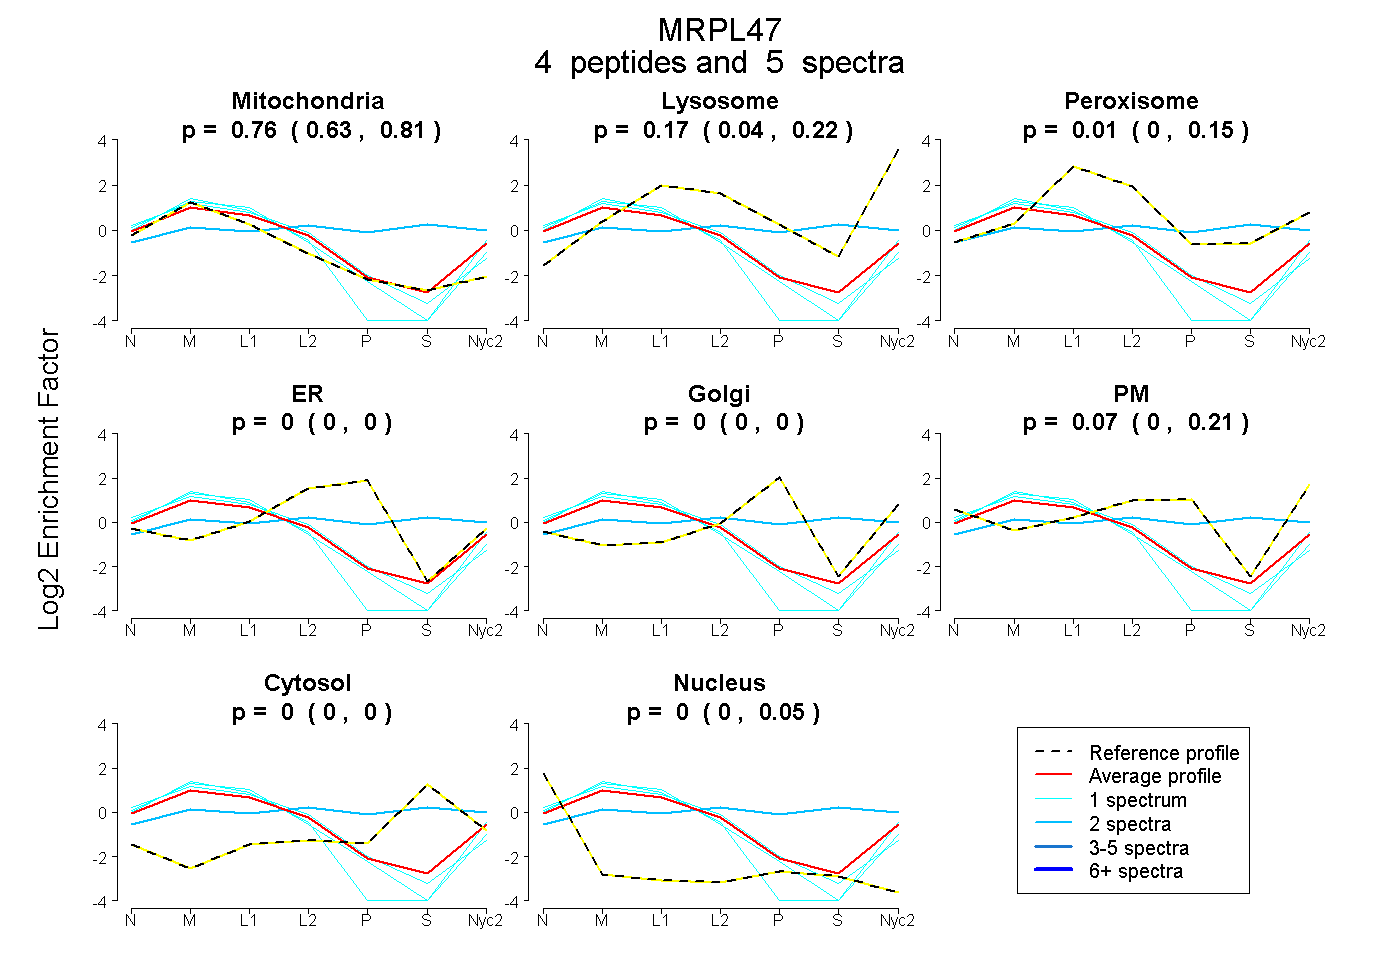
0.626 | 0.811
0.042 | 0.216
0.000 | 0.154
0.000 | 0.000
0.000 | 0.000
0.000 | 0.205
0.000 | 0.000
0.000 | 0.052
1peptide
spectra
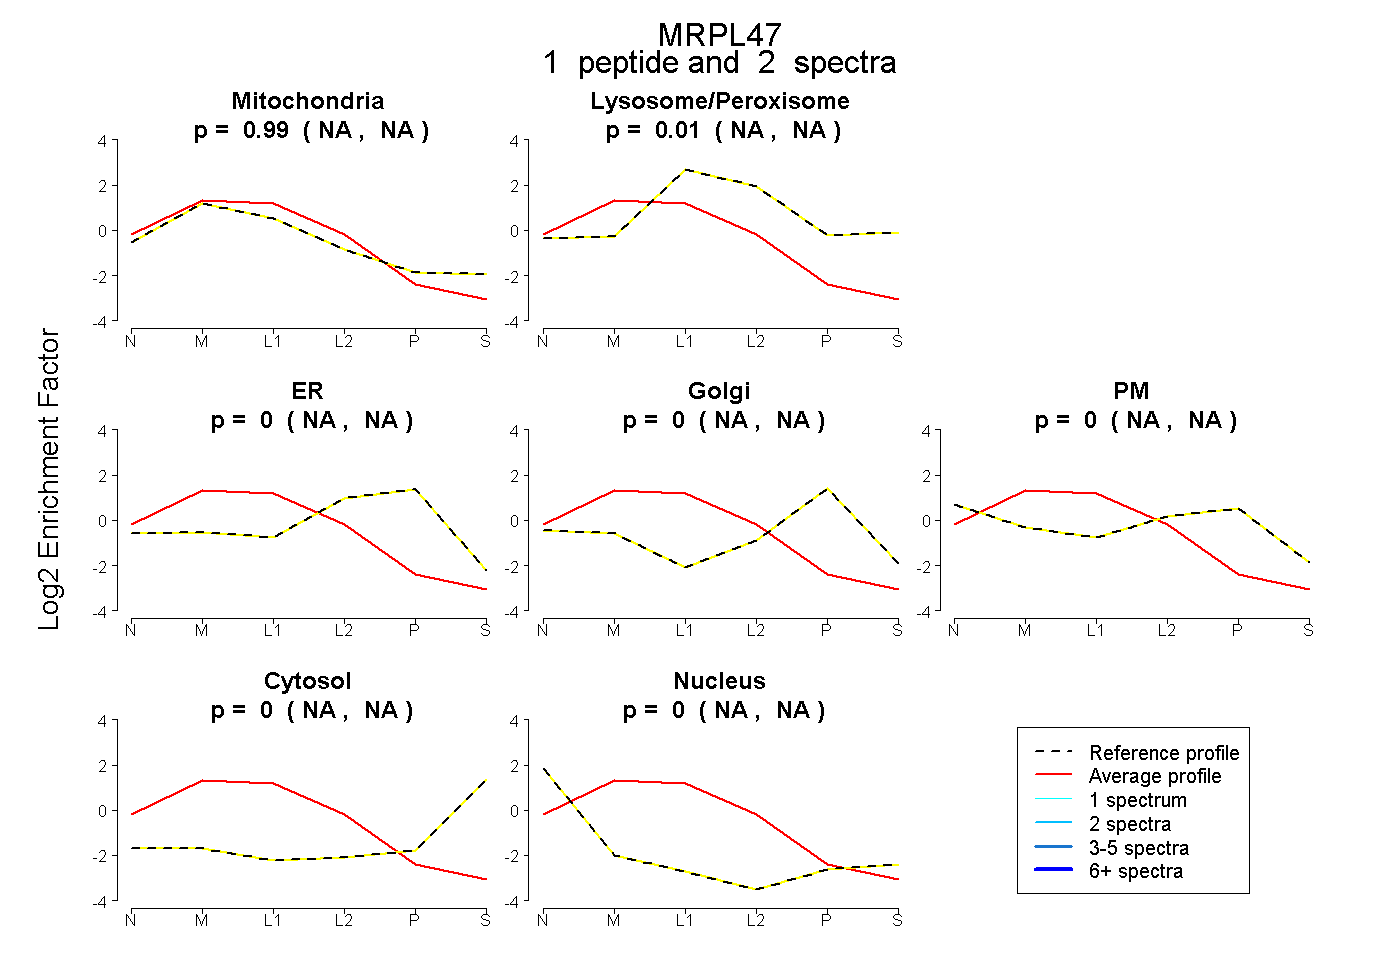
NA | NA
NA | NA
NA | NA
NA | NA
NA | NA
NA | NA
NA | NA
10peptides
spectra
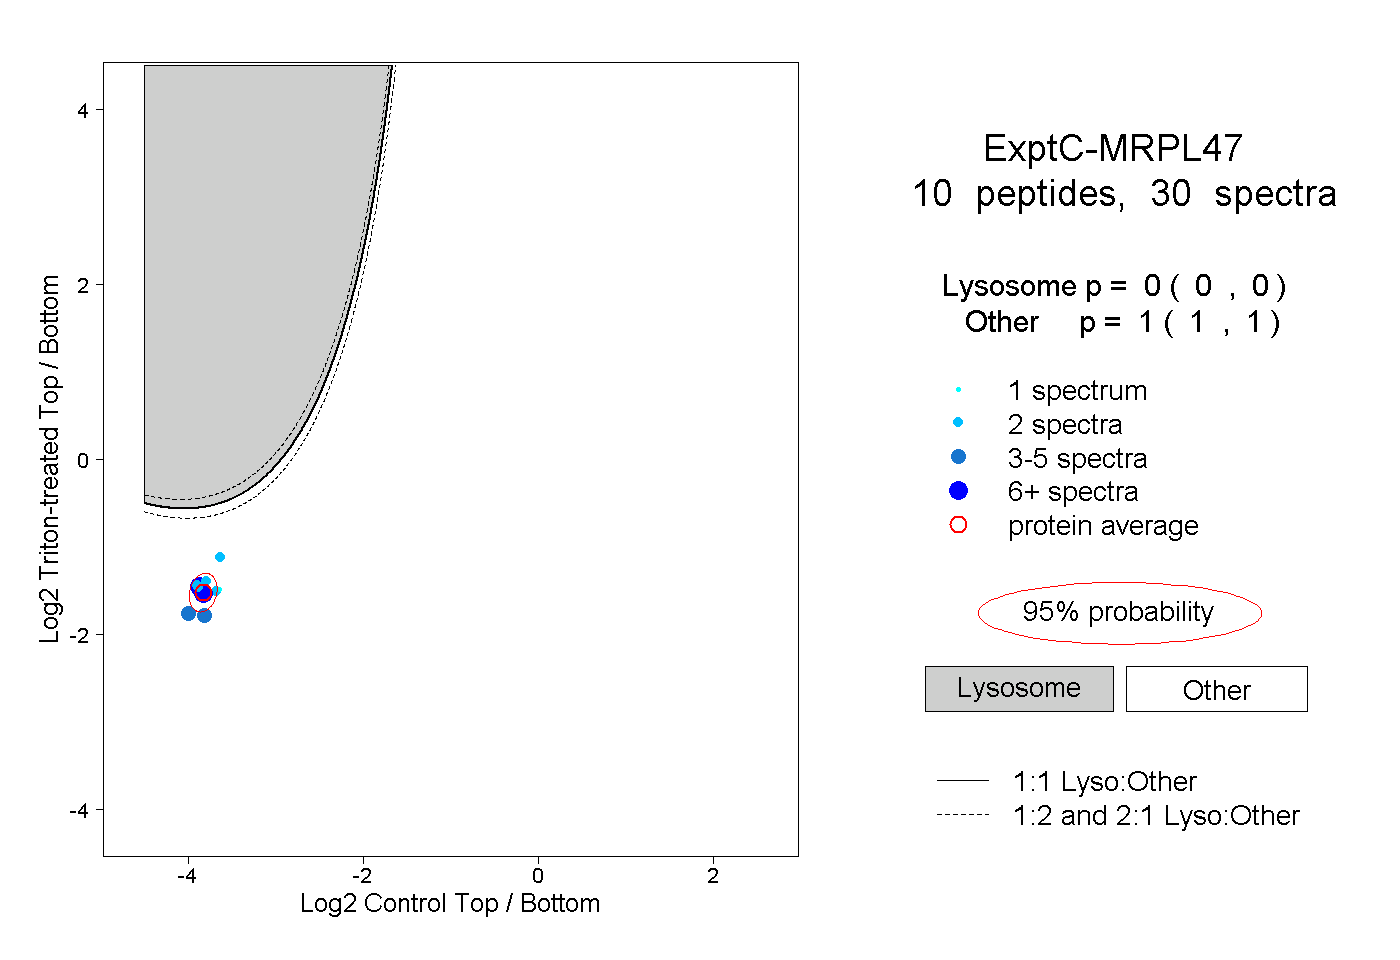
0.000 | 0.000
1.000 | 1.000
3peptides
spectra
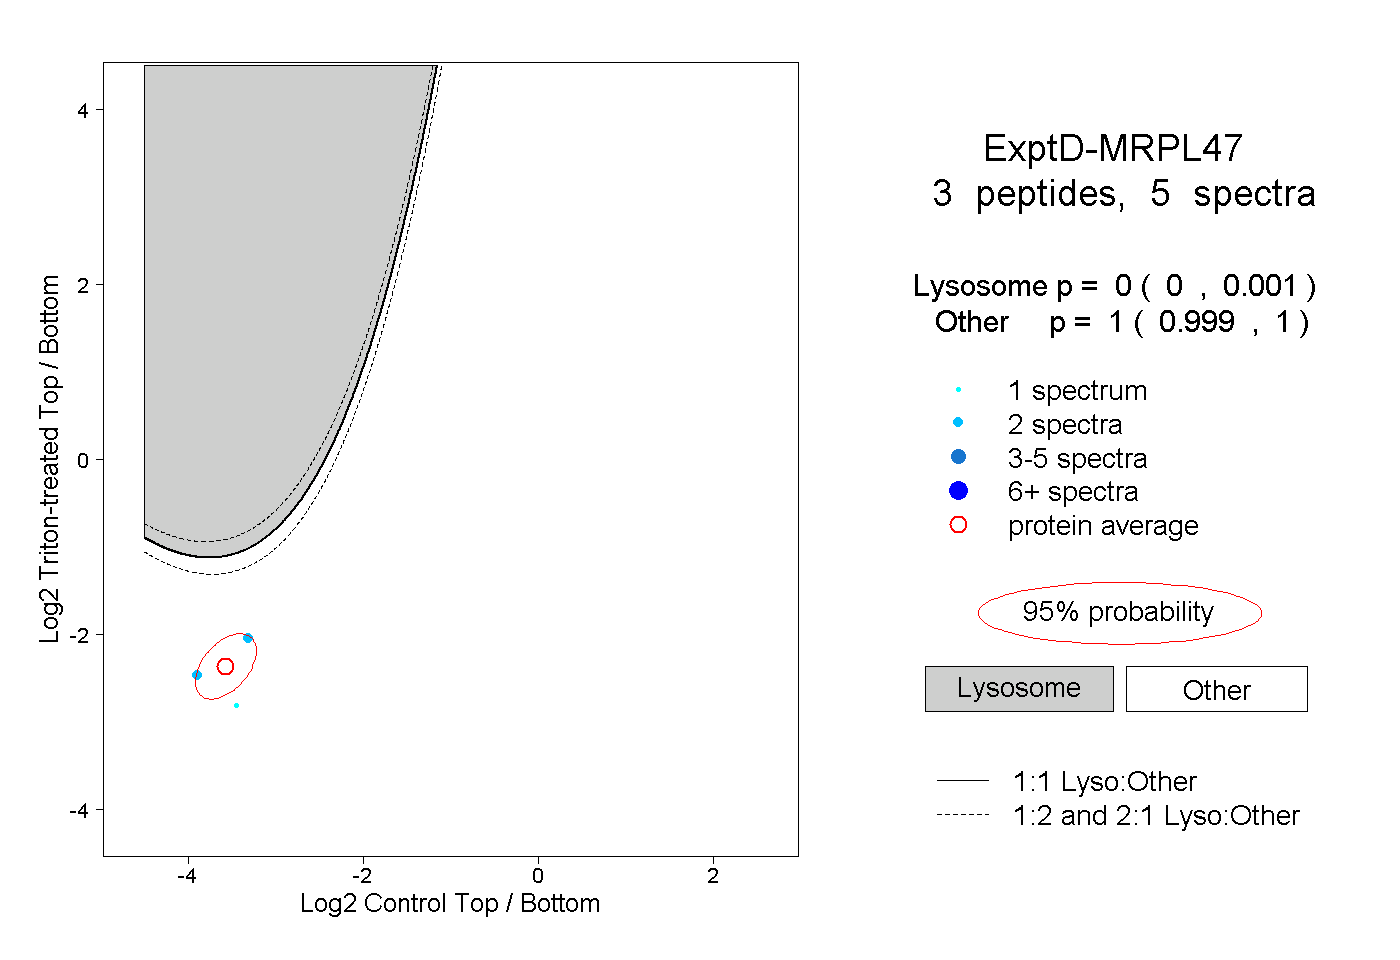
0.000 | 0.001
0.999 | 1.000