 4
4peptides
spectra
0.626 | 0.811
0.042 | 0.216
0.000 | 0.154
0.000 | 0.000
0.000 | 0.000
0.000 | 0.205
0.000 | 0.000
0.000 | 0.052
| Plot | Mito | Lyso | Perox | ER | Golgi | PM | Cytosol | Nucleus | |||||
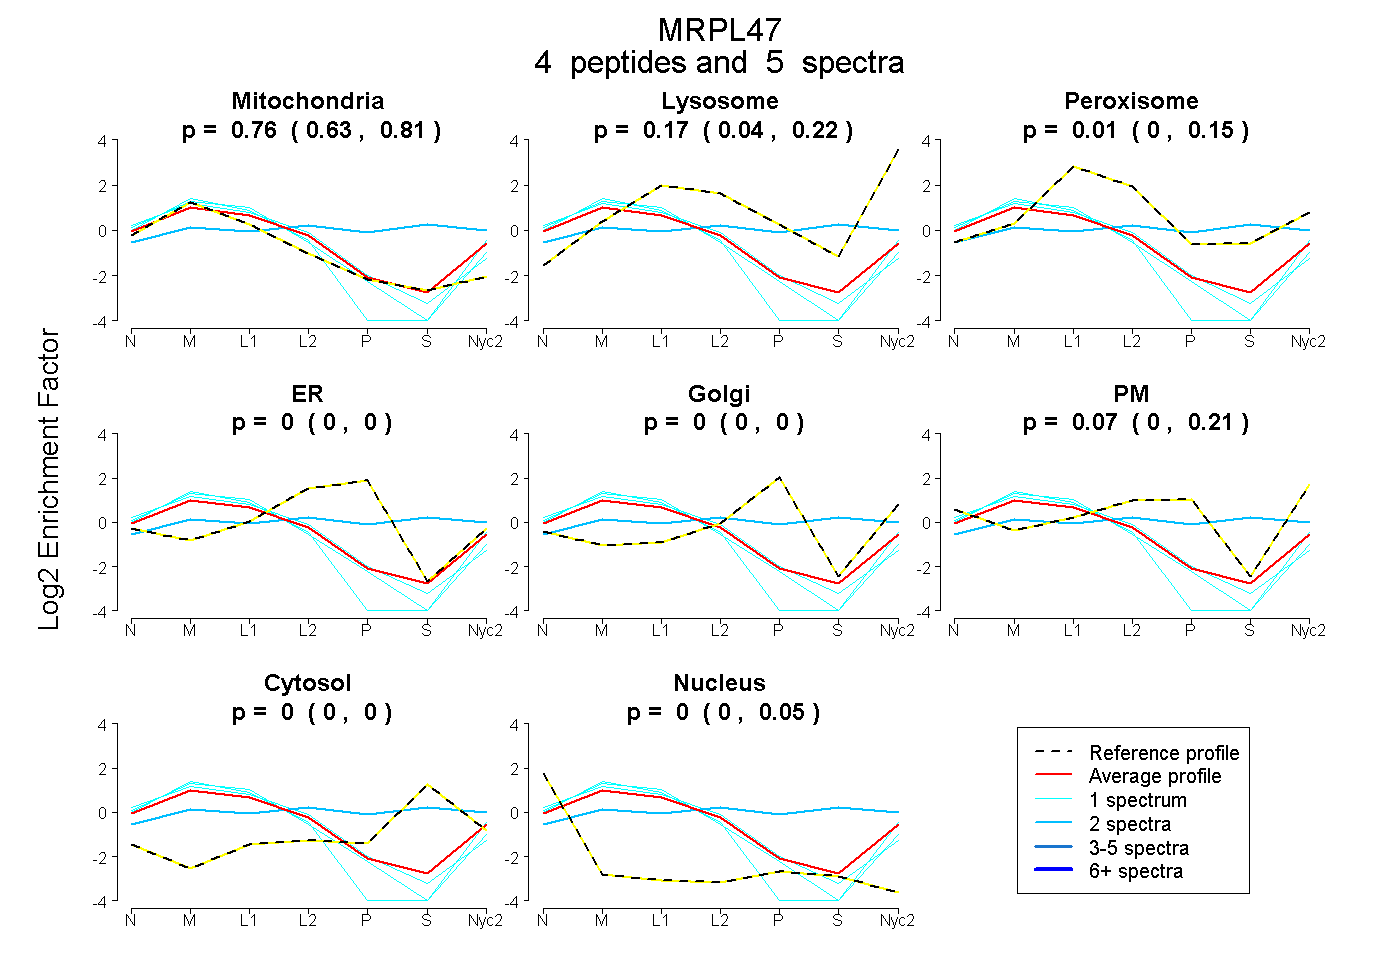
| Expt A |
4 peptides |
5 spectra |
|
0.763 0.626 | 0.811 |
0.166 0.042 | 0.216 |
0.005 0.000 | 0.154 |
0.000 0.000 | 0.000 |
0.000 0.000 | 0.000 |
0.066 0.000 | 0.205 |
0.000 0.000 | 0.000 |
0.000 0.000 | 0.052 |
| 1 spectrum, GLEEFFDDPK | 0.973 | 0.027 | 0.000 | 0.000 | 0.000 | 0.000 | 0.000 | 0.000 | ||
| 2 spectra, VVDSMDALDK | 0.094 | 0.022 | 0.350 | 0.000 | 0.196 | 0.000 | 0.338 | 0.000 | ||
| 1 spectrum, SGASWTCQQLR | 0.801 | 0.111 | 0.000 | 0.000 | 0.000 | 0.088 | 0.000 | 0.000 | ||
| 1 spectrum, LLQTGQEKPRPGAWR | 0.796 | 0.000 | 0.085 | 0.000 | 0.000 | 0.119 | 0.000 | 0.000 |
| Plot | Mito | Lyso or Perox | ER | Golgi | PM | Cytosol | Nucleus | ||||||
| Expt B |
1 peptide |
2 spectra |
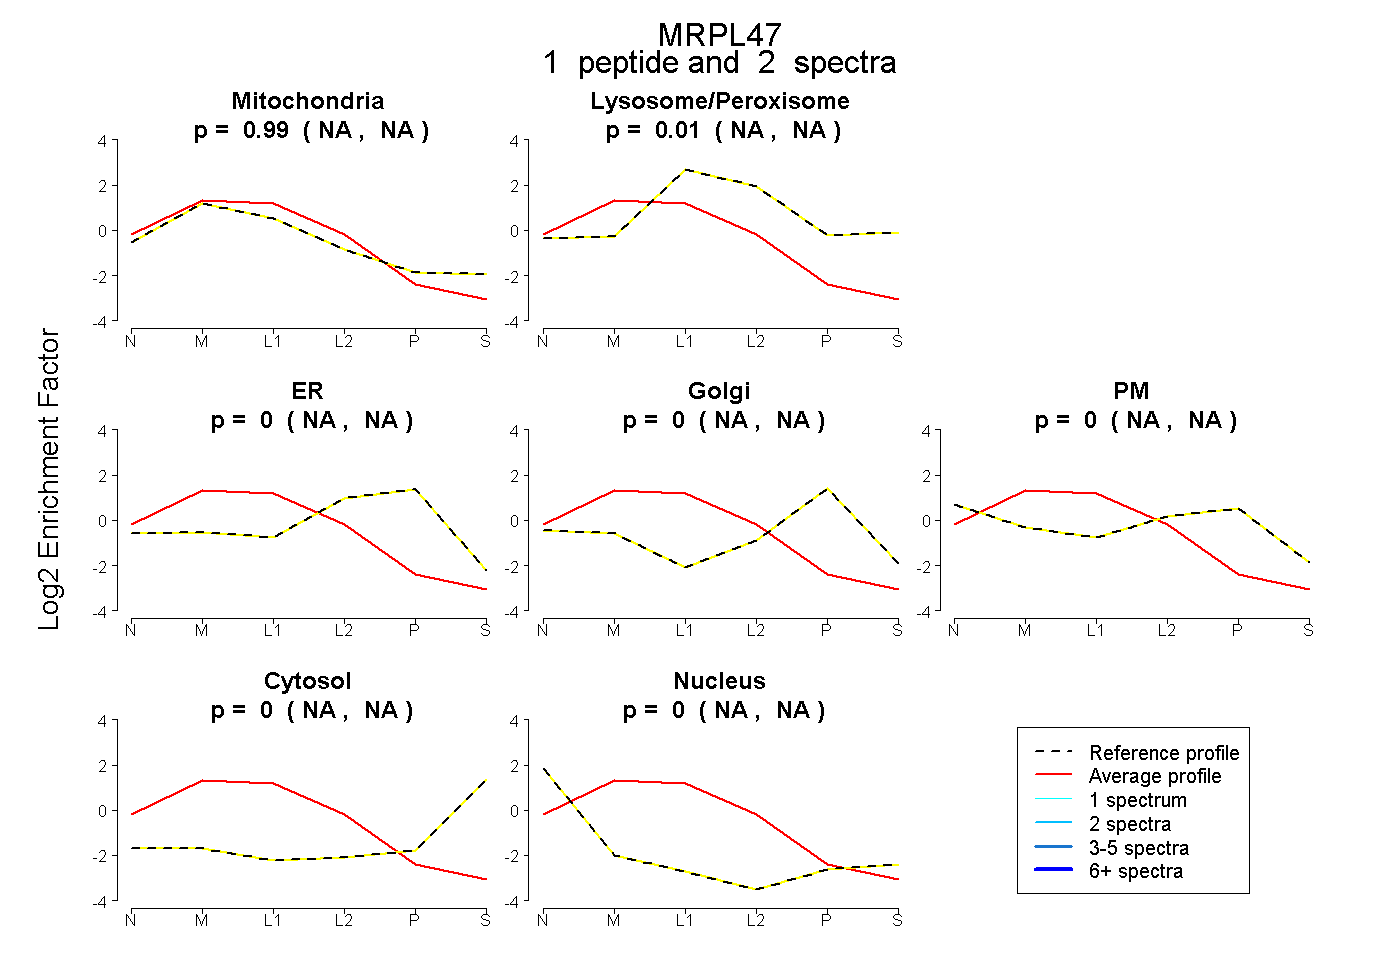 |
0.994 NA | NA |
0.006 NA | NA |
0.000 NA | NA |
0.000 NA | NA |
0.000 NA | NA |
0.000 NA | NA |
0.000 NA | NA |
|||
| Plot | Lyso | Other | |||||||||||
| Expt C |
10 peptides |
30 spectra |
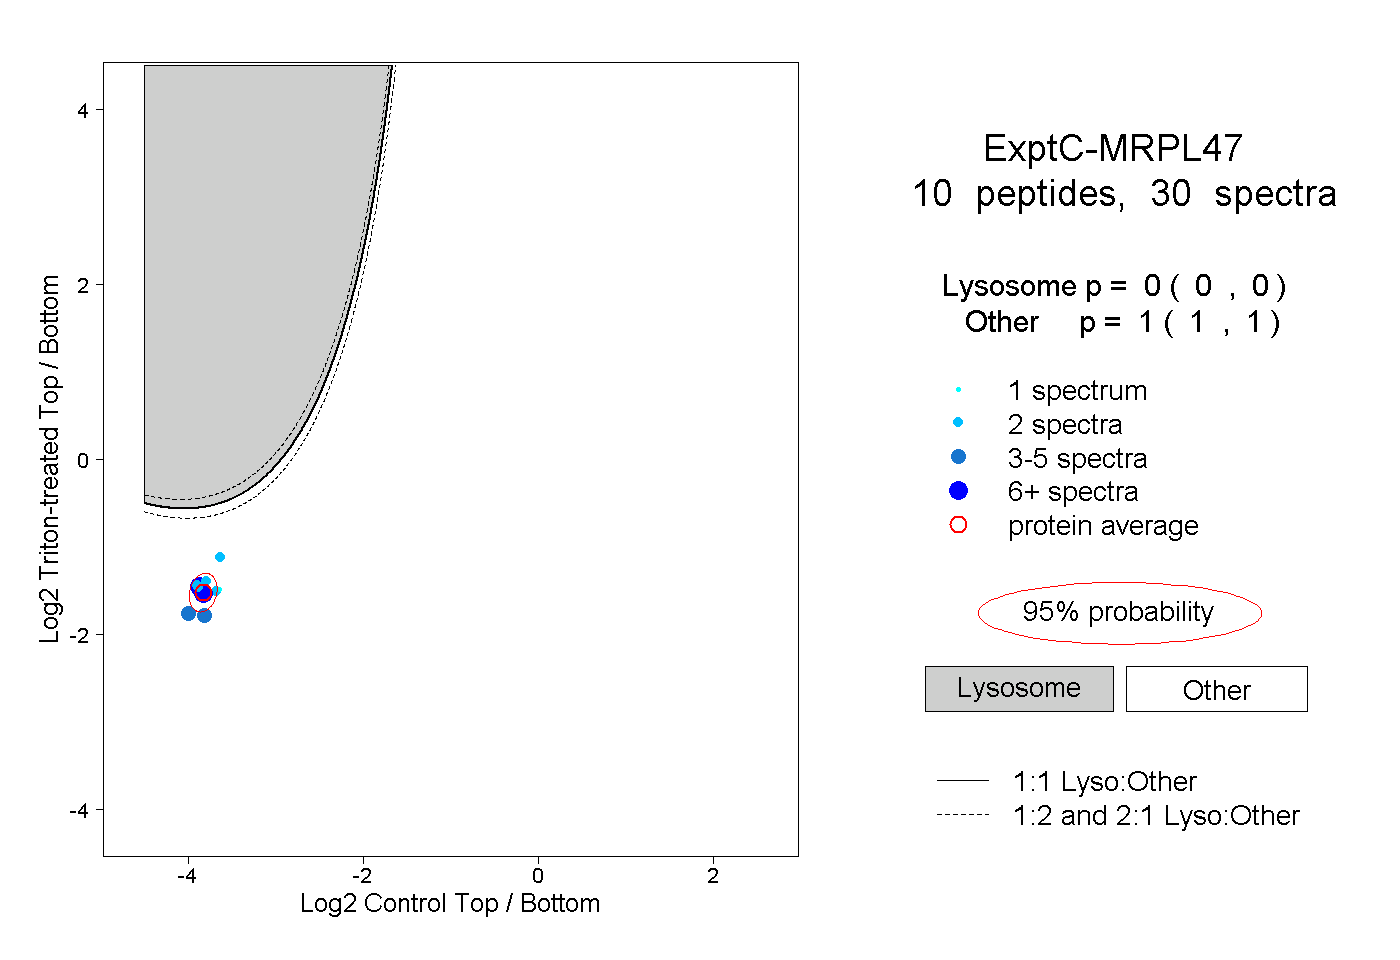 |
0.000 0.000 | 0.000 |
1.000 1.000 | 1.000 |
||||||||
| Plot | Lyso | Other | |||||||||||
| Expt D |
3 peptides |
5 spectra |
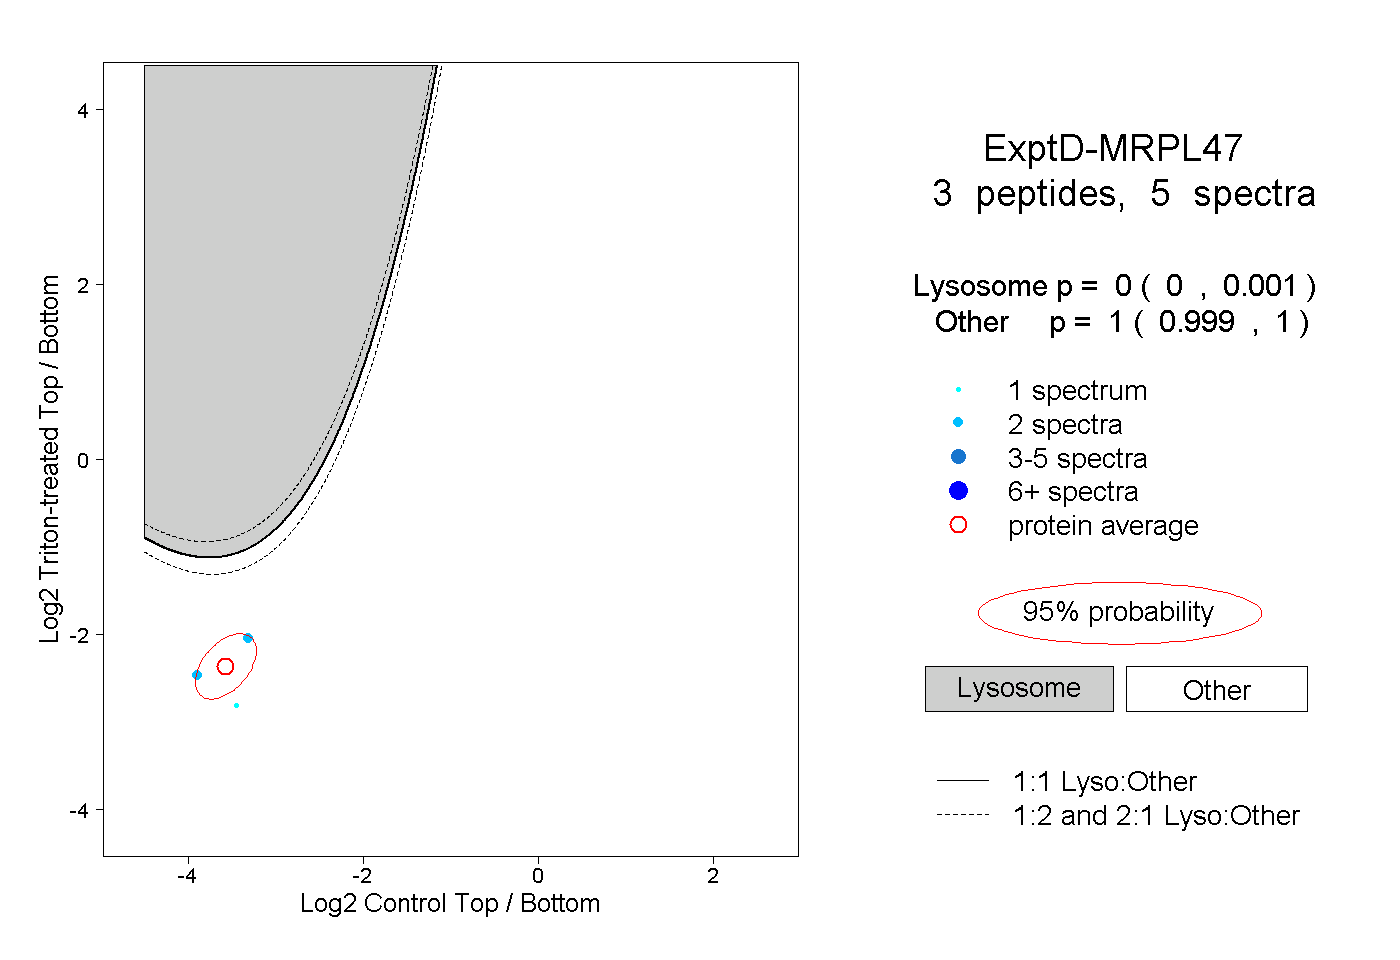 |
0.000 0.000 | 0.001 |
1.000 0.999 | 1.000 |