 4
4peptides
spectra
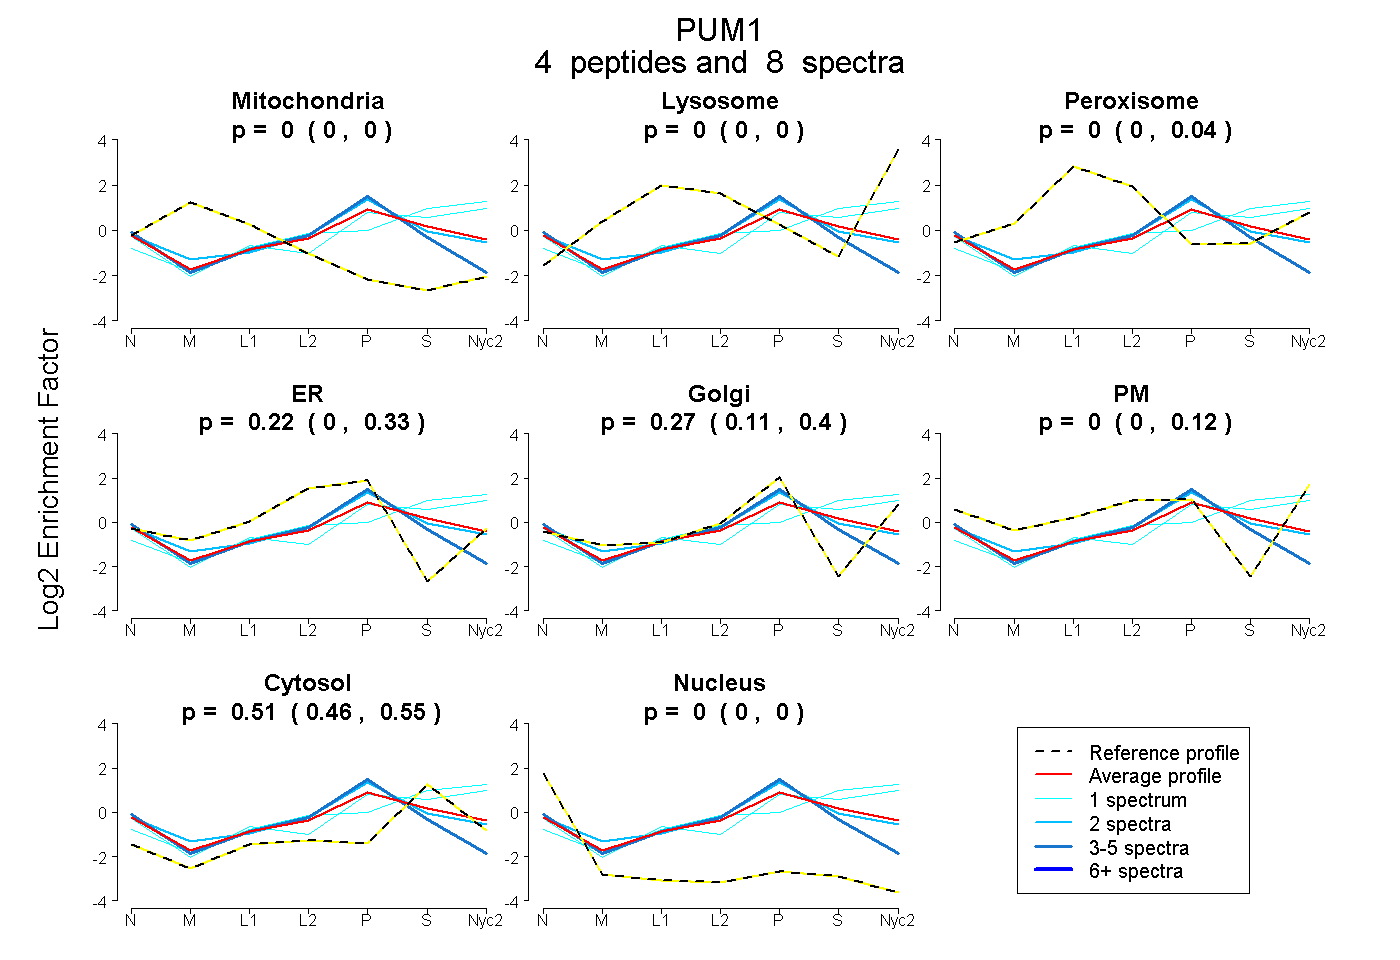
0.000 | 0.000
0.000 | 0.000
0.000 | 0.039
0.001 | 0.328
0.106 | 0.396
0.000 | 0.118
0.460 | 0.550
0.000 | 0.000
2peptides
spectra
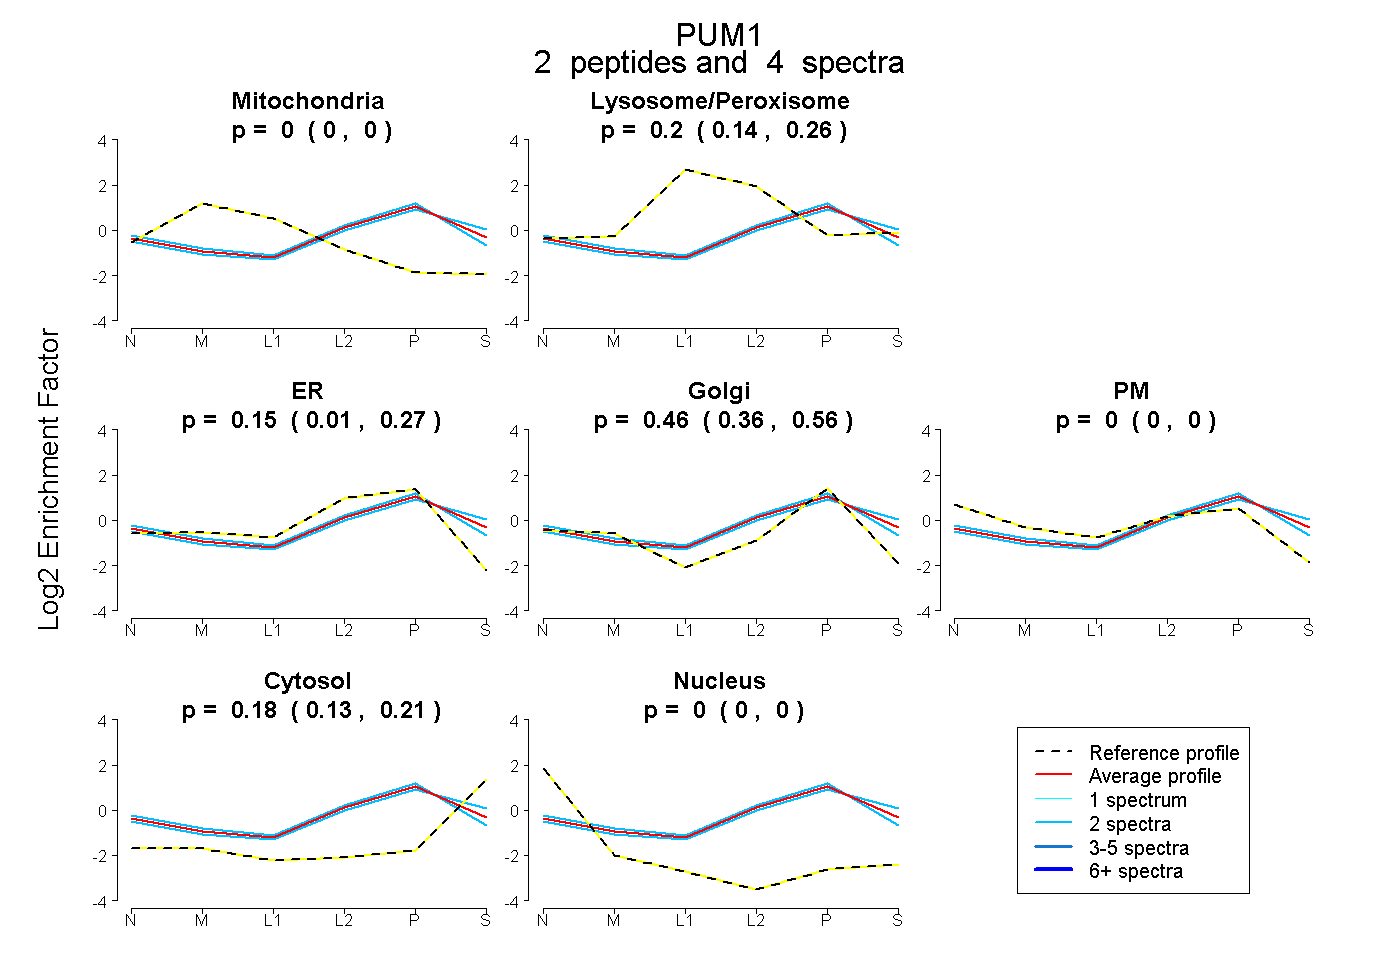
0.000 | 0.000
0.143 | 0.260
0.006 | 0.274
0.356 | 0.556
0.000 | 0.000
0.135 | 0.210
0.000 | 0.000
5peptides
spectra
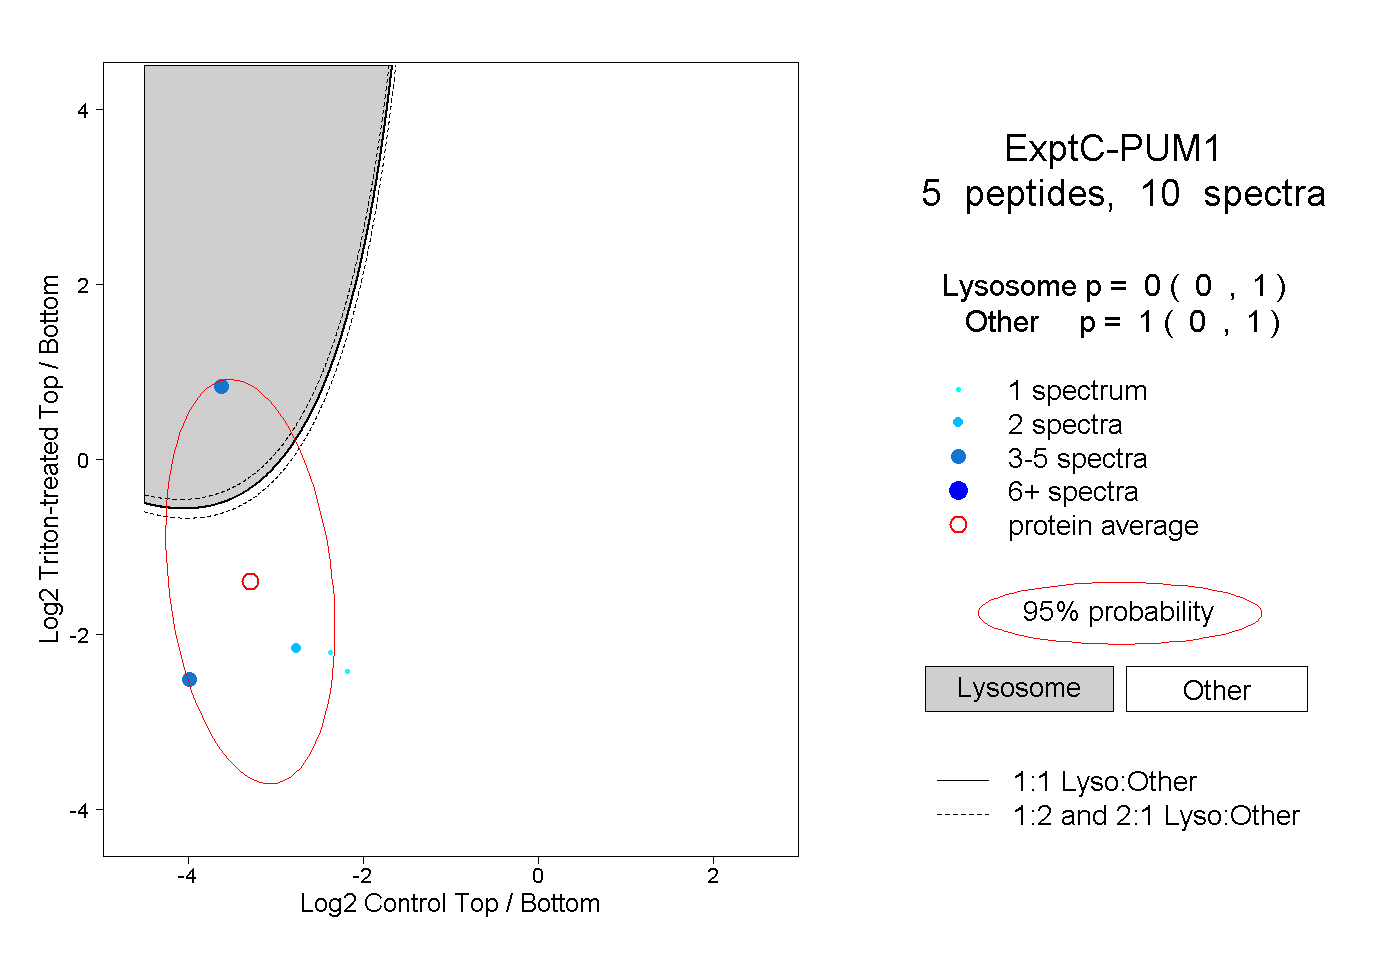
0.000 | 1.000
0.000 | 1.000