PUM1
[ENSRNOP00000015831]
Main page
| | | Plot |
Mito |
Lyso |
|
Perox |
ER |
Golgi |
PM |
Cytosol |
Nucleus |
|
| Expt A |
 4
4
peptides |
8
spectra |
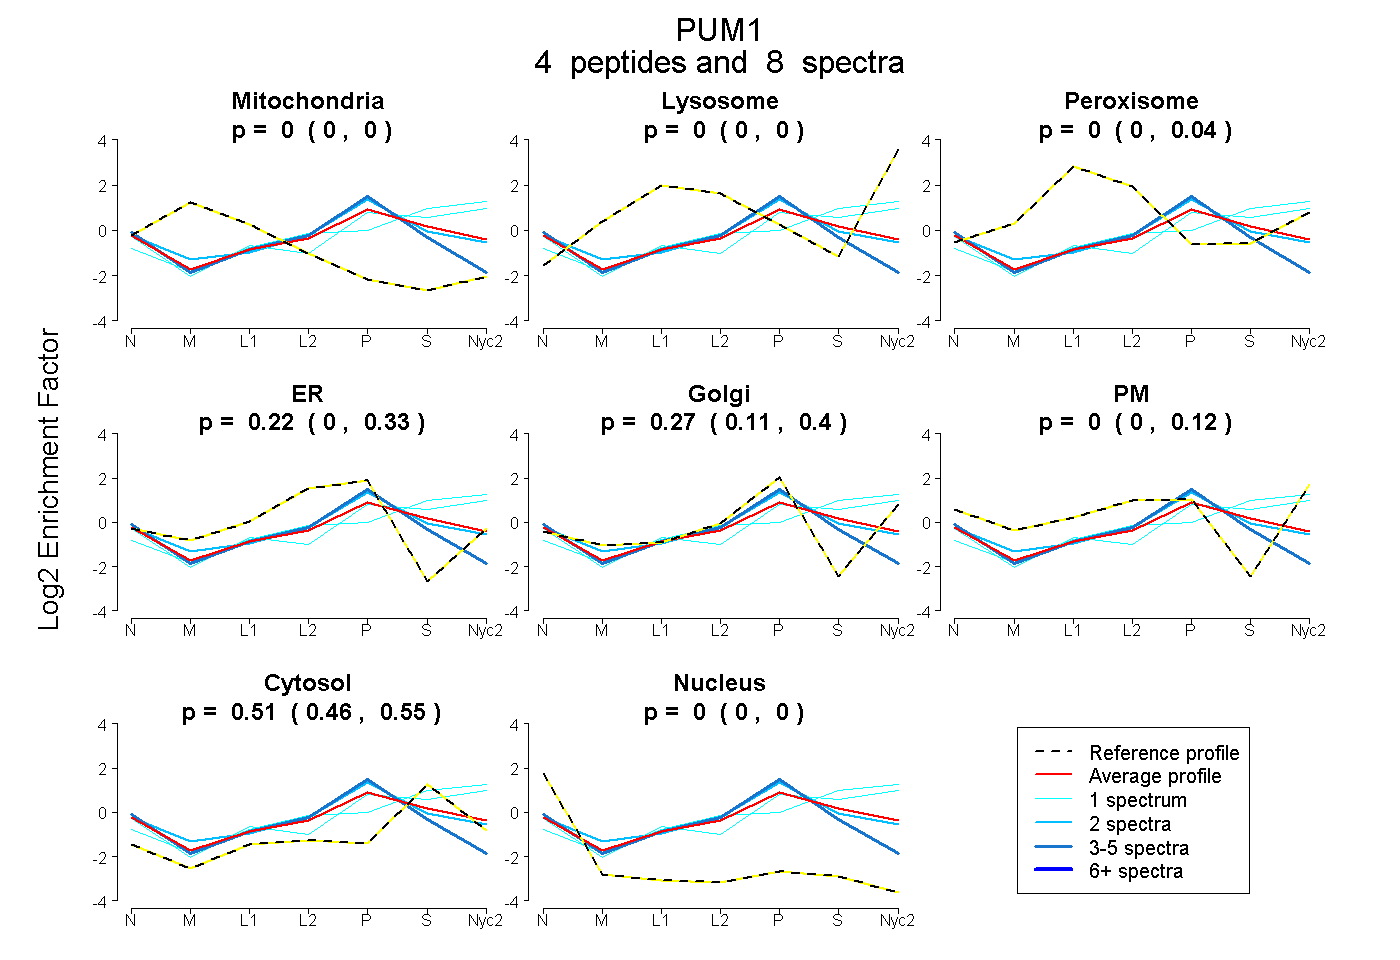 |
0.000
0.000 | 0.000 |
0.000
0.000 | 0.000 |
|
0.000
0.000 | 0.039 |
0.219
0.001 | 0.328 |
0.268
0.106 | 0.396 |
0.000
0.000 | 0.118 |
0.513
0.460 | 0.550 |
0.000
0.000 | 0.000 |
|
| | | Plot |
Mito |
|
Lyso or Perox |
|
ER |
Golgi |
PM |
Cytosol |
Nucleus |
|
| Expt B |
2
peptides |
4
spectra |
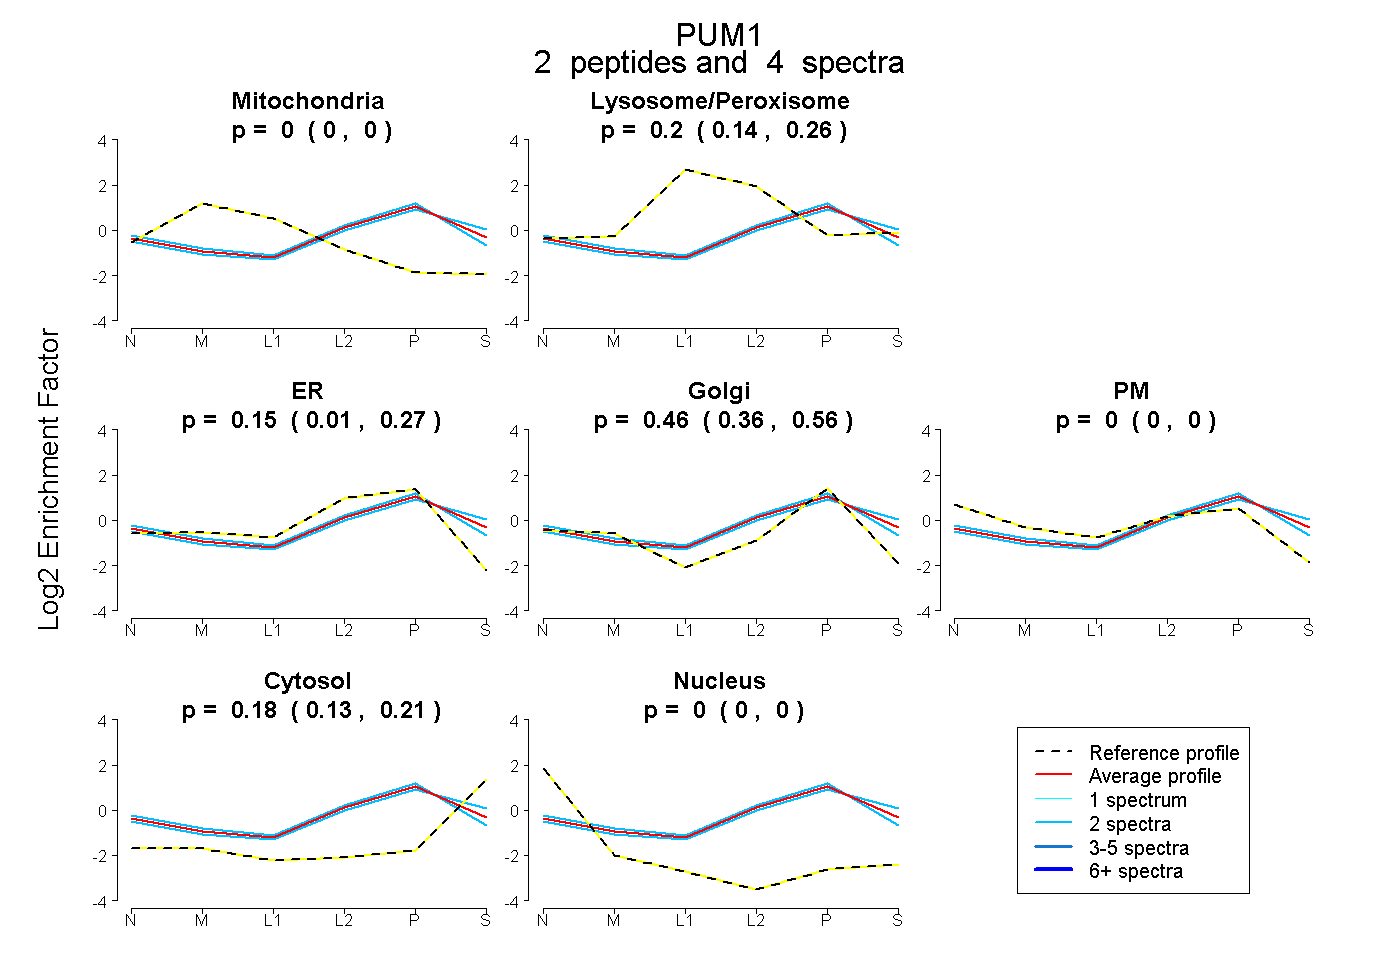 |
0.000
0.000 | 0.000 |
|
0.205
0.143 | 0.260 |
|
0.154
0.006 | 0.274 |
0.463
0.356 | 0.556 |
0.000
0.000 | 0.000 |
0.178
0.135 | 0.210 |
0.000
0.000 | 0.000 |
|
| 2 spectra, LLEDFR |
0.000 |
|
0.198 |
|
0.140 |
0.402 |
0.000 |
0.260 |
0.000 |
|
| 2 spectra, IRPHIATLR |
0.000 |
|
0.209 |
|
0.169 |
0.519 |
0.005 |
0.098 |
0.000 |
|
| | | Plot |
|
Lyso |
|
|
|
|
|
|
|
Other |
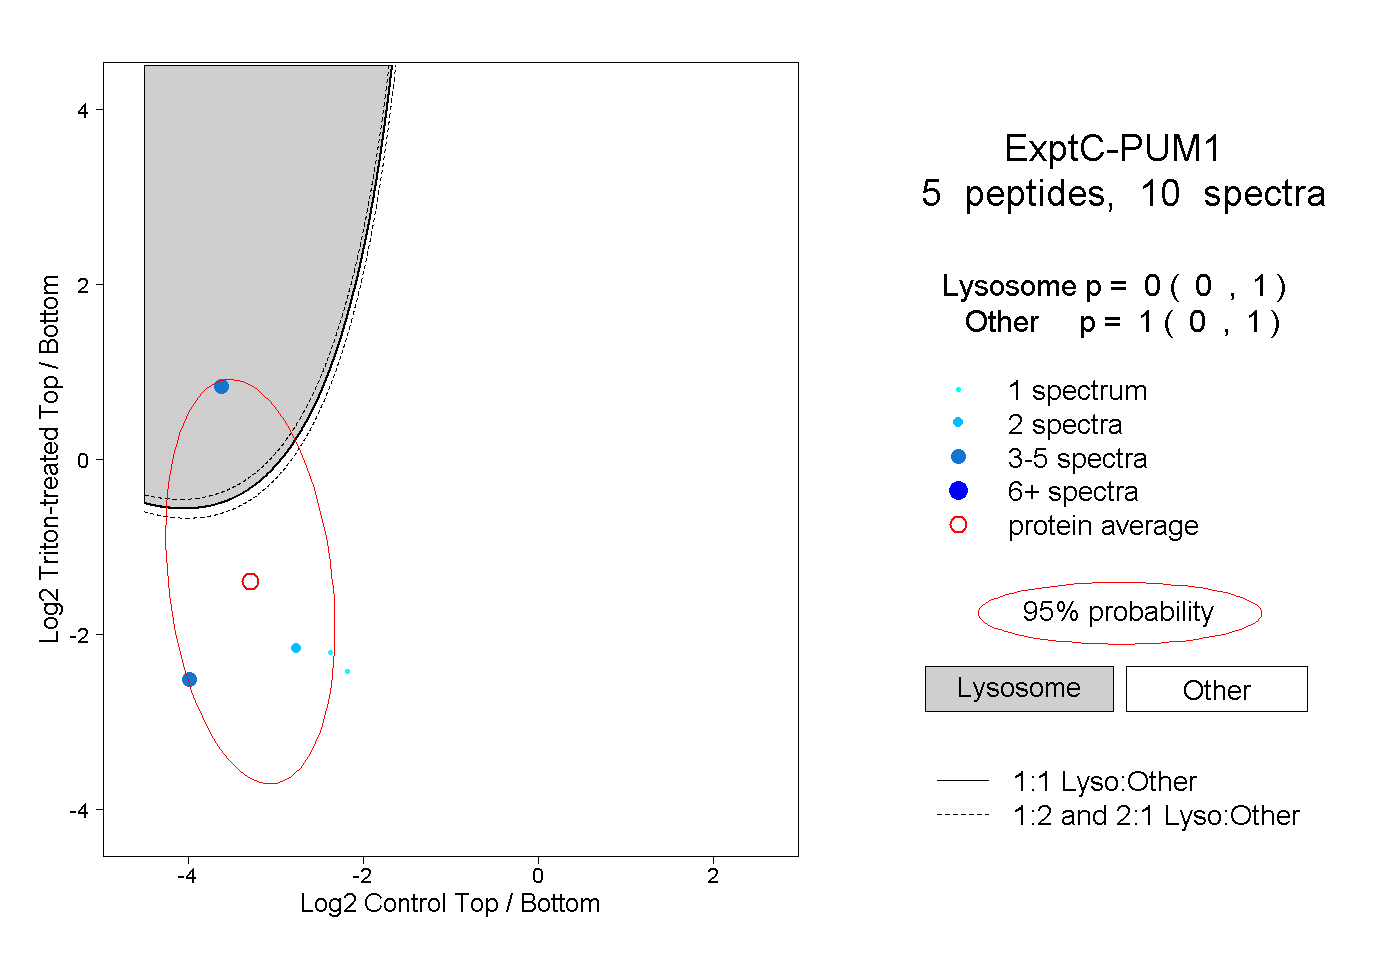
| Expt C |
5
peptides |
10
spectra |
 |
|
0.000
0.000 | 1.000 |
|
|
|
|
|
|
|
1.000
0.000 | 1.000 |