 8
8peptides
spectra
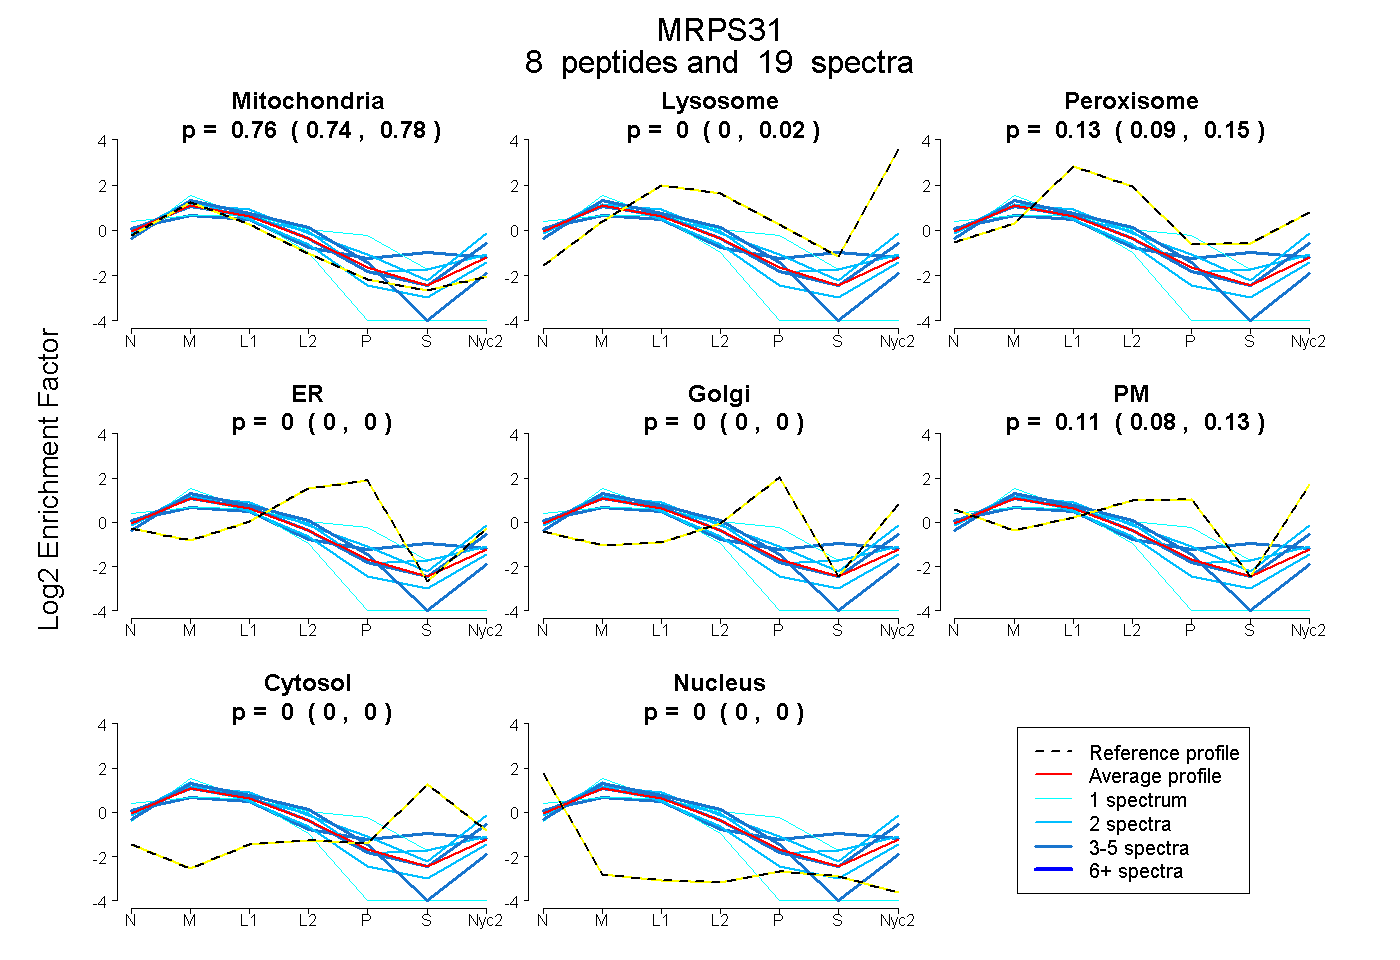
0.738 | 0.779
0.000 | 0.023
0.093 | 0.151
0.000 | 0.003
0.000 | 0.000
0.078 | 0.133
0.000 | 0.000
0.000 | 0.000
2peptides
spectra
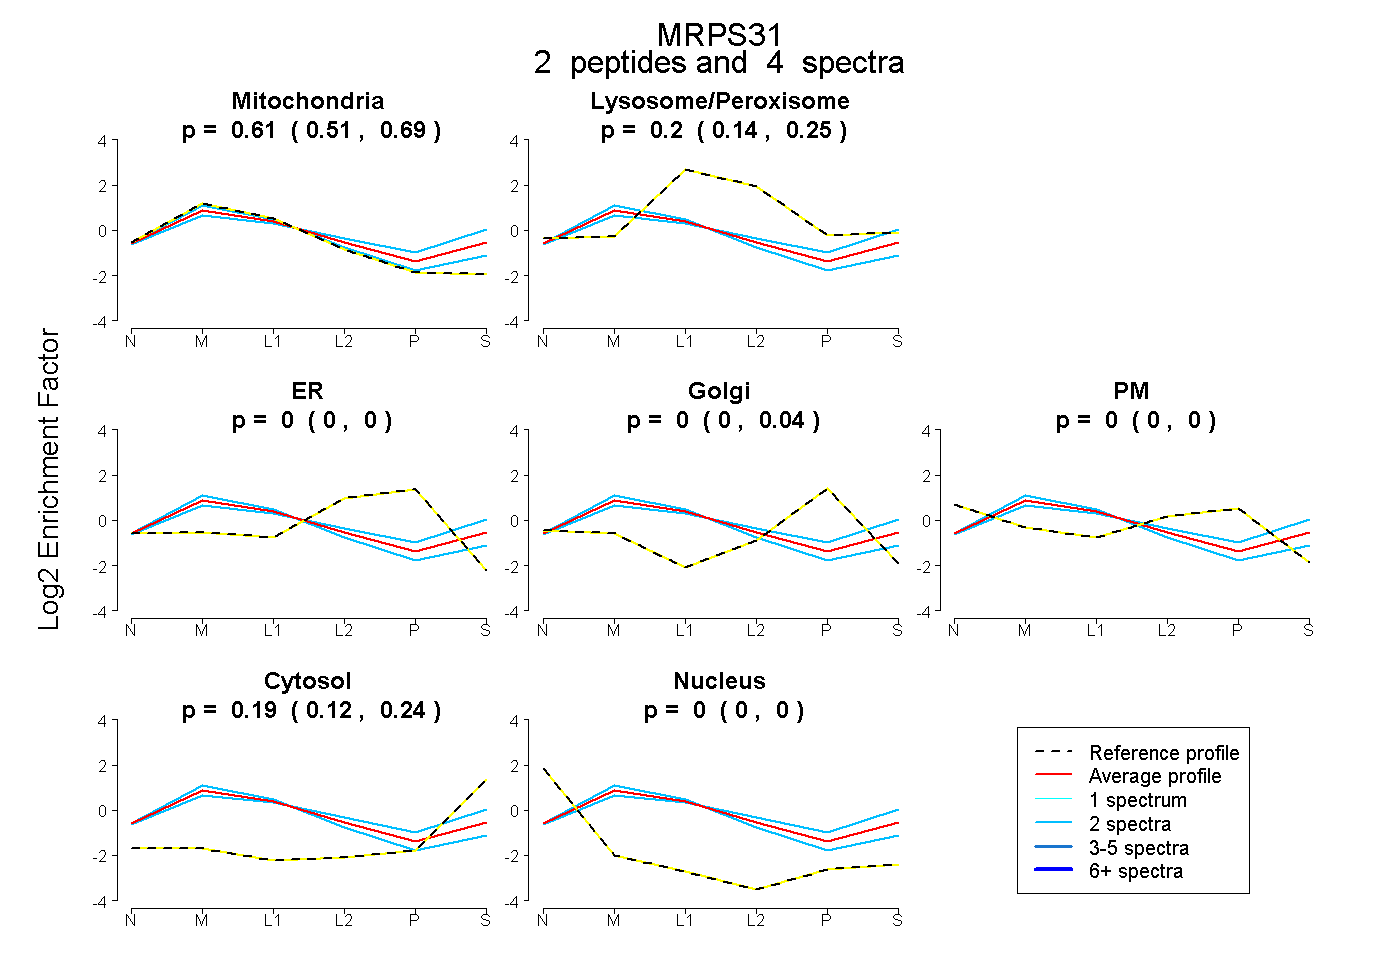
0.507 | 0.690
0.142 | 0.248
0.000 | 0.000
0.000 | 0.041
0.000 | 0.000
0.118 | 0.239
0.000 | 0.000
12peptides
spectra
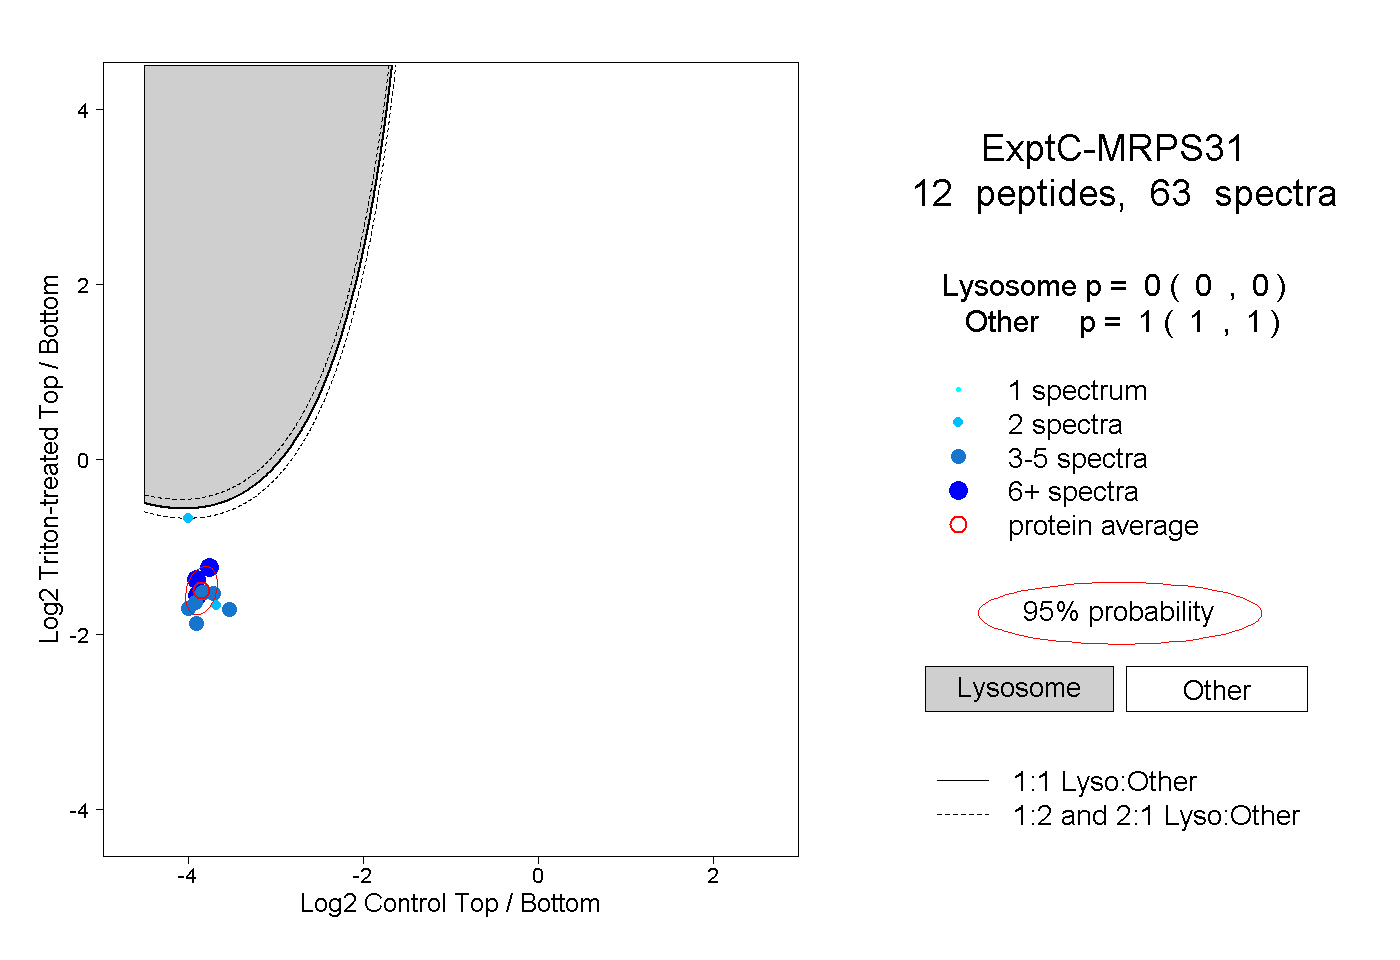
0.000 | 0.000
1.000 | 1.000
5peptides
spectra
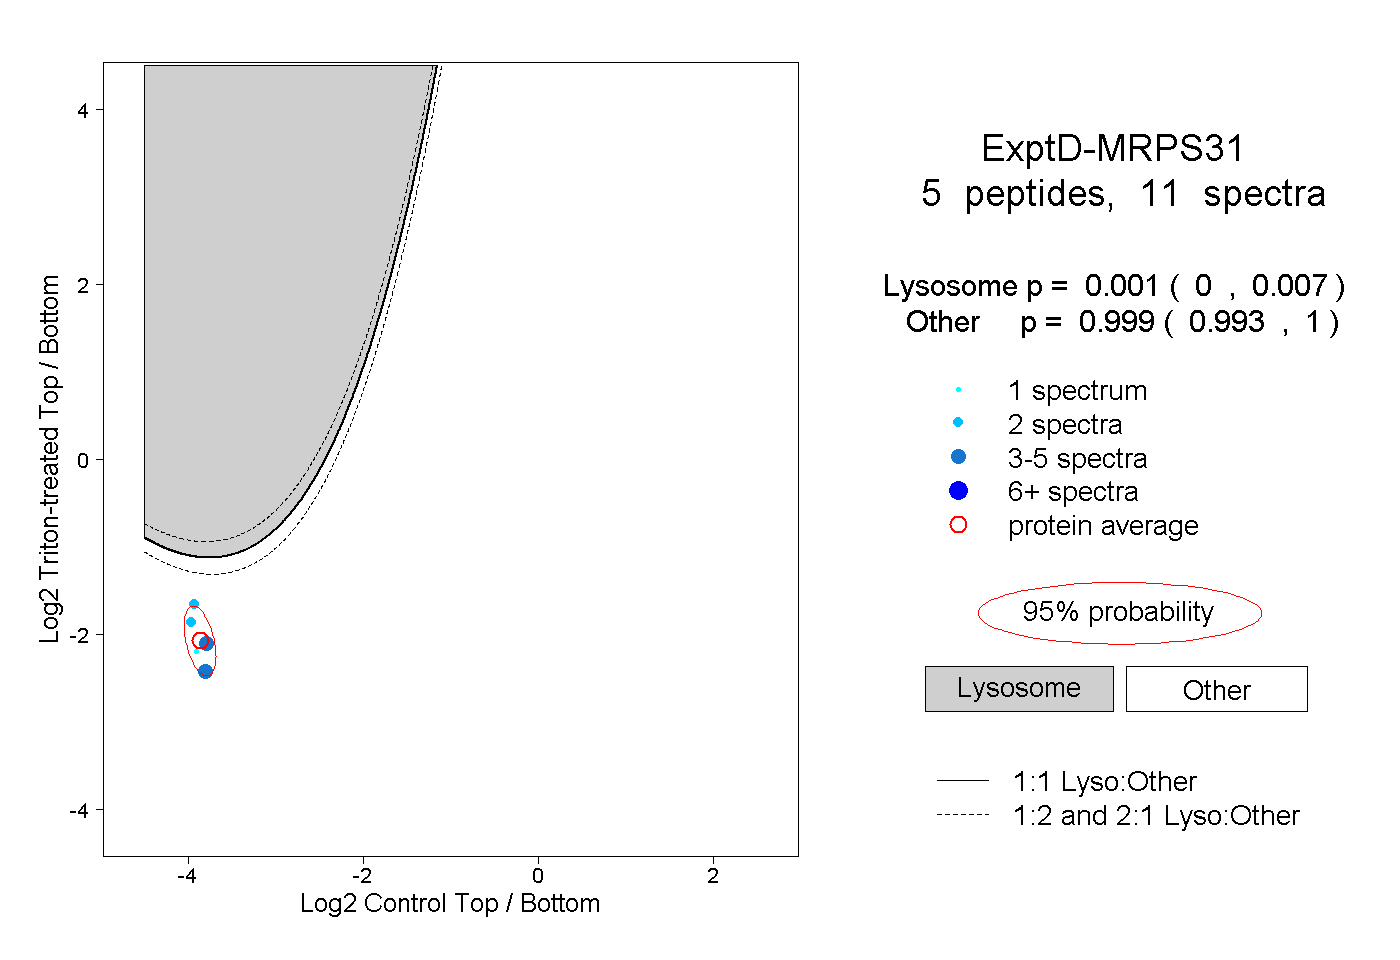
0.000 | 0.007
0.993 | 1.000