 8
8peptides
spectra
0.738 | 0.779
0.000 | 0.023
0.093 | 0.151
0.000 | 0.003
0.000 | 0.000
0.078 | 0.133
0.000 | 0.000
0.000 | 0.000
| Plot | Mito | Lyso | Perox | ER | Golgi | PM | Cytosol | Nucleus | |||||
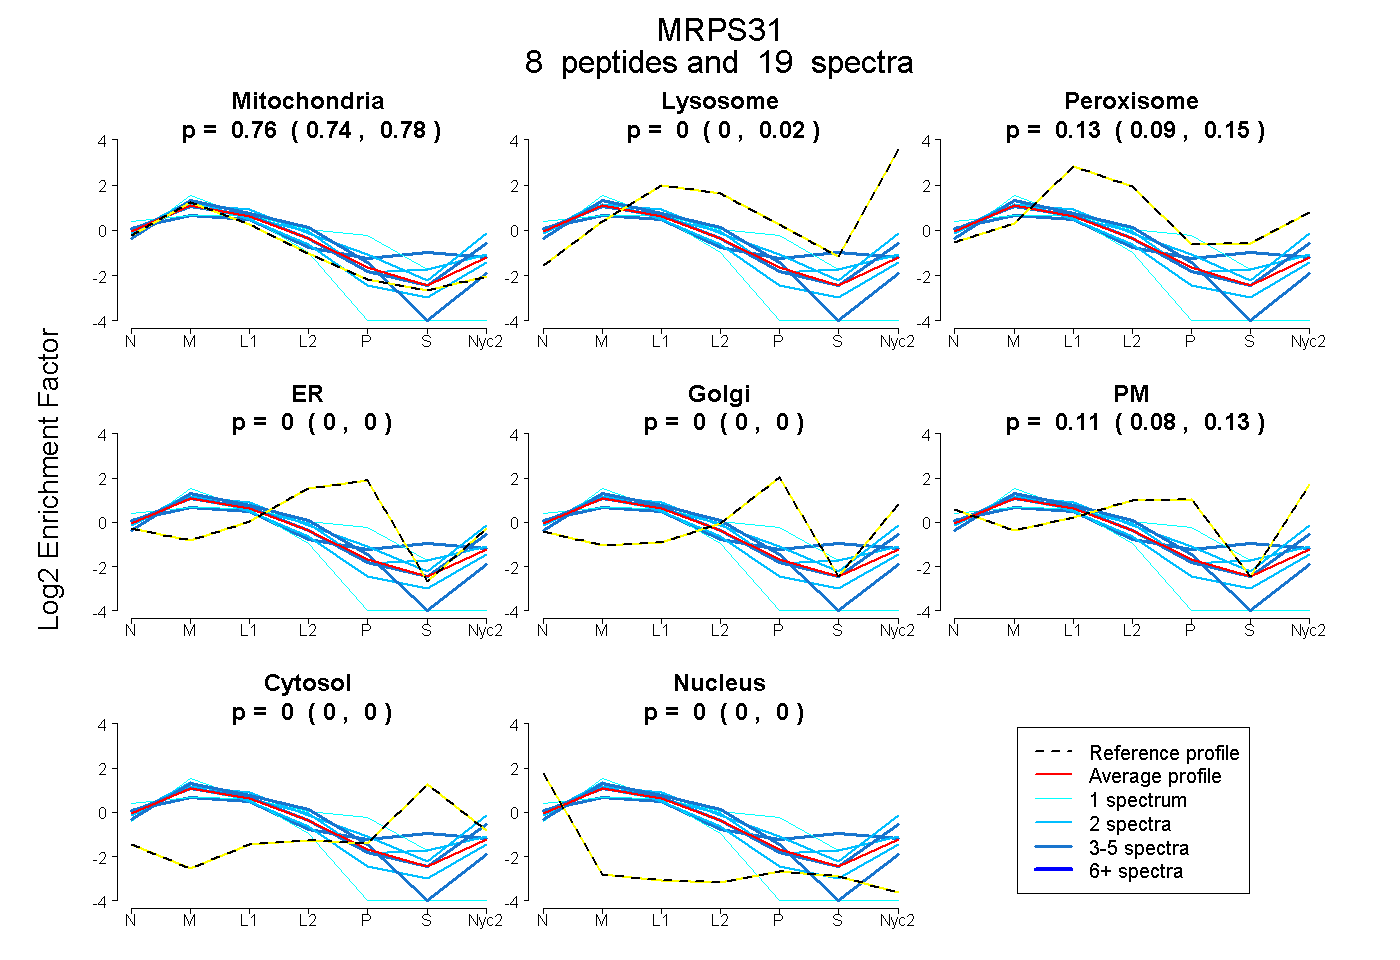
| Expt A |
8 peptides |
19 spectra |
|
0.759 0.738 | 0.779 |
0.000 0.000 | 0.023 |
0.129 0.093 | 0.151 |
0.000 0.000 | 0.003 |
0.000 0.000 | 0.000 |
0.112 0.078 | 0.133 |
0.000 0.000 | 0.000 |
0.000 0.000 | 0.000 |
| 2 spectra, NPYLSVR | 0.935 | 0.065 | 0.000 | 0.000 | 0.000 | 0.000 | 0.000 | 0.000 | ||
| 3 spectra, VSFTQIISNMK | 0.807 | 0.000 | 0.000 | 0.193 | 0.000 | 0.000 | 0.000 | 0.000 | ||
| 4 spectra, VQLNTANVK | 0.732 | 0.138 | 0.037 | 0.000 | 0.000 | 0.093 | 0.000 | 0.000 | ||
| 2 spectra, QLQQHEEESR | 0.674 | 0.000 | 0.260 | 0.000 | 0.000 | 0.030 | 0.026 | 0.010 | ||
| 2 spectra, QPPAHLETAVGR | 0.605 | 0.198 | 0.058 | 0.000 | 0.000 | 0.138 | 0.000 | 0.000 | ||
| 4 spectra, ALGEPPR | 0.571 | 0.000 | 0.187 | 0.000 | 0.000 | 0.048 | 0.194 | 0.000 | ||
| 1 spectrum, DDQSVPANETSQK | 0.448 | 0.000 | 0.207 | 0.238 | 0.012 | 0.056 | 0.000 | 0.038 | ||
| 1 spectrum, NLLDVIK | 0.960 | 0.000 | 0.000 | 0.000 | 0.000 | 0.000 | 0.000 | 0.040 |
| Plot | Mito | Lyso or Perox | ER | Golgi | PM | Cytosol | Nucleus | ||||||
| Expt B |
2 peptides |
4 spectra |
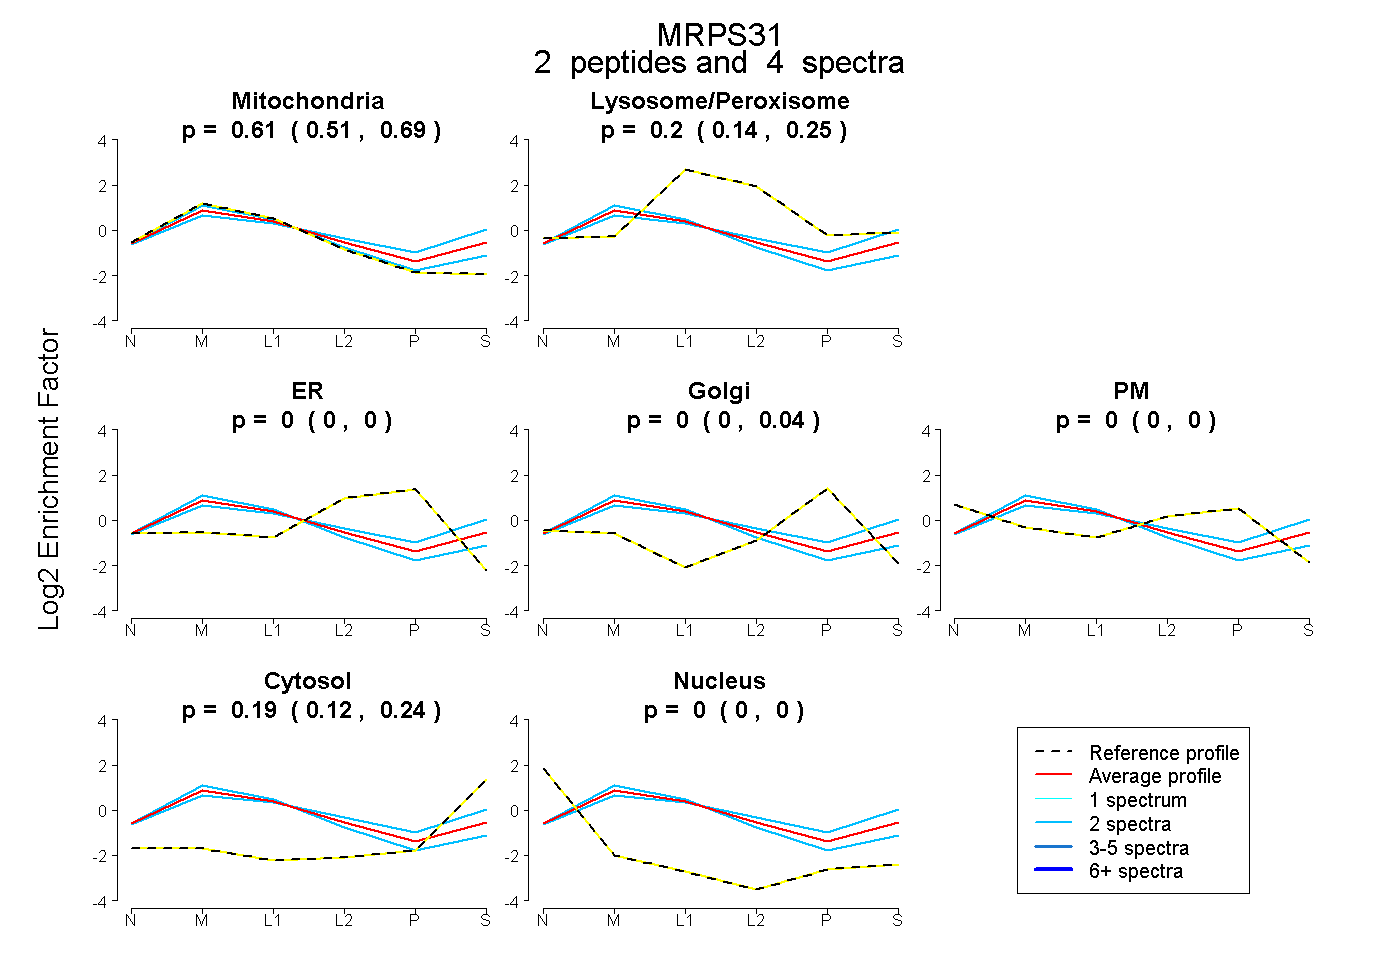 |
0.610 0.507 | 0.690 |
0.201 0.142 | 0.248 |
0.000 0.000 | 0.000 |
0.000 0.000 | 0.041 |
0.000 0.000 | 0.000 |
0.189 0.118 | 0.239 |
0.000 0.000 | 0.000 |
|||
| Plot | Lyso | Other | |||||||||||
| Expt C |
12 peptides |
63 spectra |
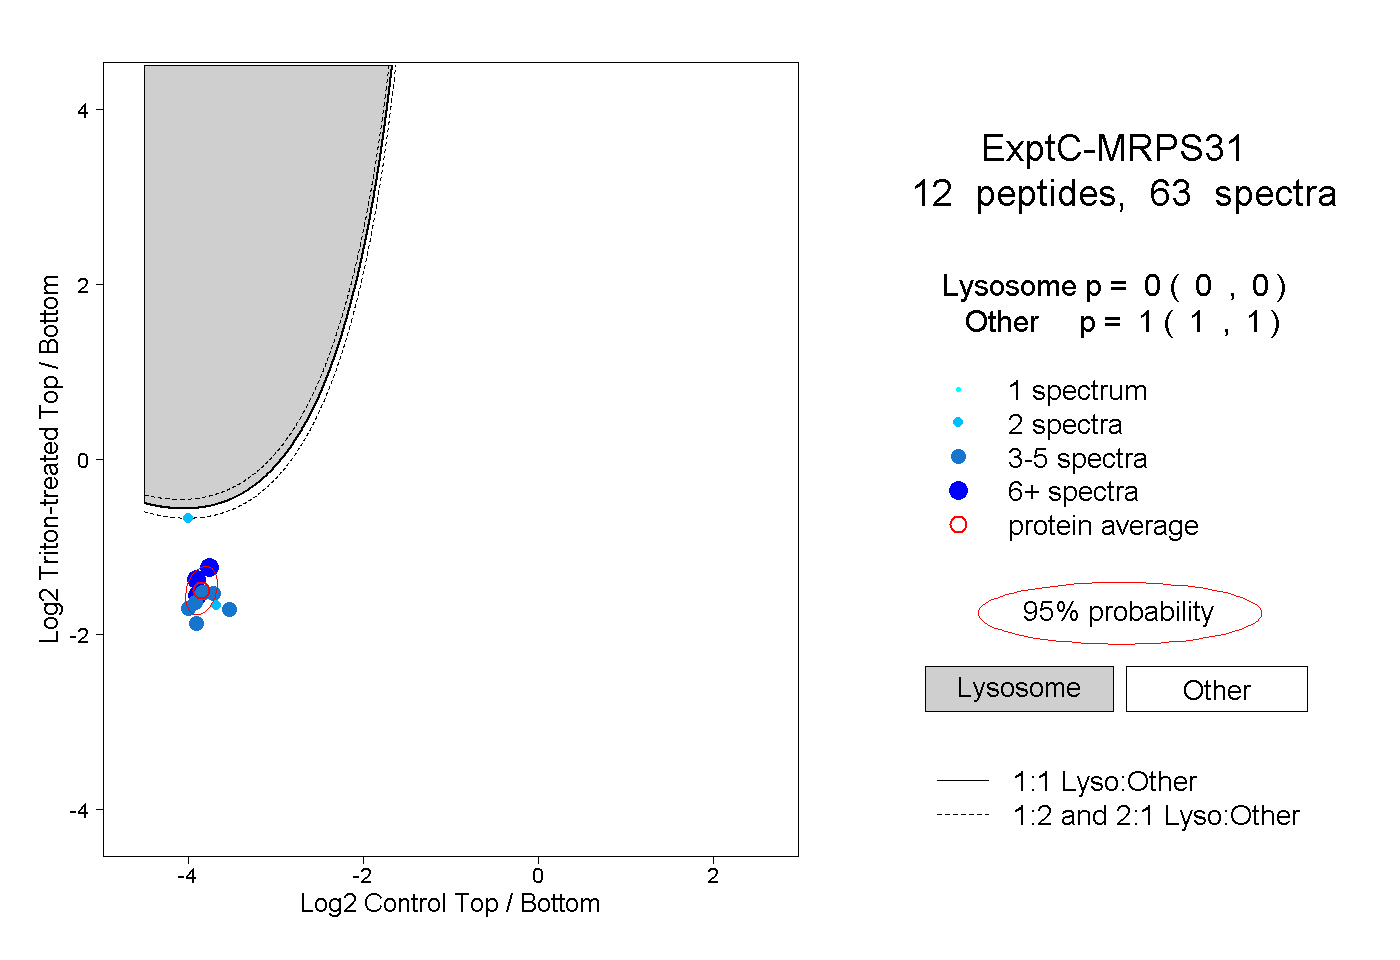 |
0.000 0.000 | 0.000 |
1.000 1.000 | 1.000 |
||||||||
| Plot | Lyso | Other | |||||||||||
| Expt D |
5 peptides |
11 spectra |
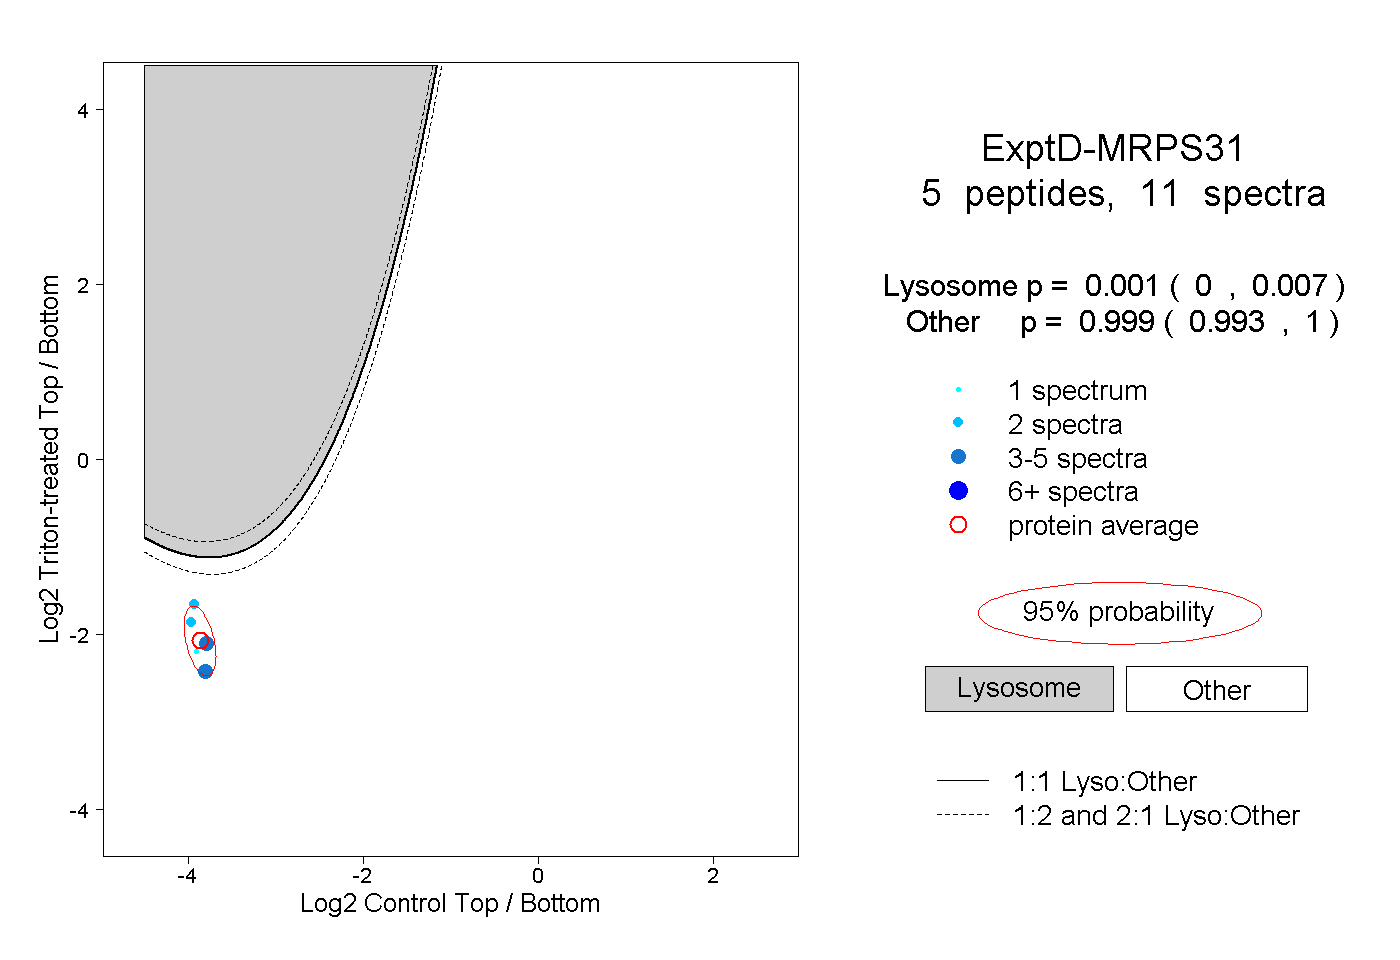 |
0.001 0.000 | 0.007 |
0.999 0.993 | 1.000 |